In this blog post, we will be discussing about the translucency feature, that is there to help us enhance the results presentation of our fe analyses from within Abaqus Visualization.
Exemplary Model for Post Processing
The exemplary model used for in this blog post, is shown in Figure 1.
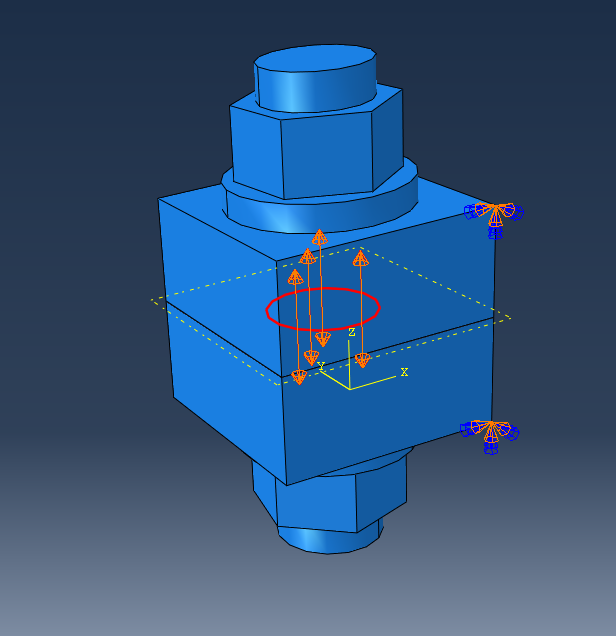
Figure 1: fe model assembly , loading and BCs.
It concerns a static non linear bolt pretension analysis of a simplified connection, comprising of two blocks, and an pretensioned M12 bolt.
Results Enhancement With Translucency
Using the translucency feature in Abaqus, allows the user to look inside of a part or a region of a large, complex assembly, while still being maintaining a visual representation of the regions or parts enclosing the focus region with respect to the results. The translucency feature can be used in image and video generation in an output database (*.odb).
Additionally the translucency feature can greatly assist a person in familiarizing themselves with the fe analysis at hand, so it is a useful feature to have when presenting results to people who are irrelevant with the content/purpose of the modelling.
The translucency feature in the Visualization module of Abaqus, can be accessed in 3 ways.
Access From the Display Groups
Display groups allow the user to quickly keep the entities of interest, shown on the screen, while removing redundant/less important entities, to enhance visibility and reduce the screen clutter, making the overall user experience more friendly.
So in this particular example, we are interested in plotting the contact stresses (CPRESS) on the block to block interface. Figure 2 shows the CPRESS results in MPa, with the face of interest highlighted.
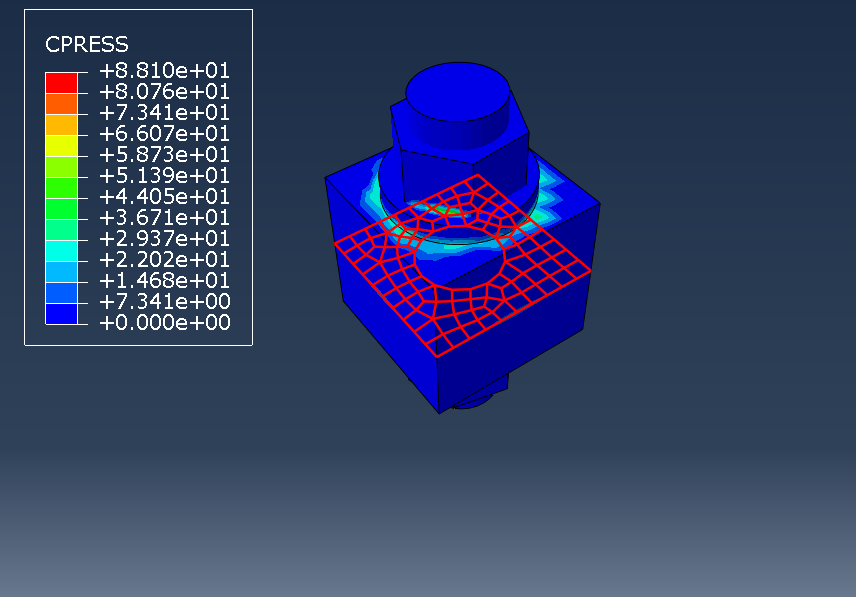
Figure 2: Region of interest for results visualization.
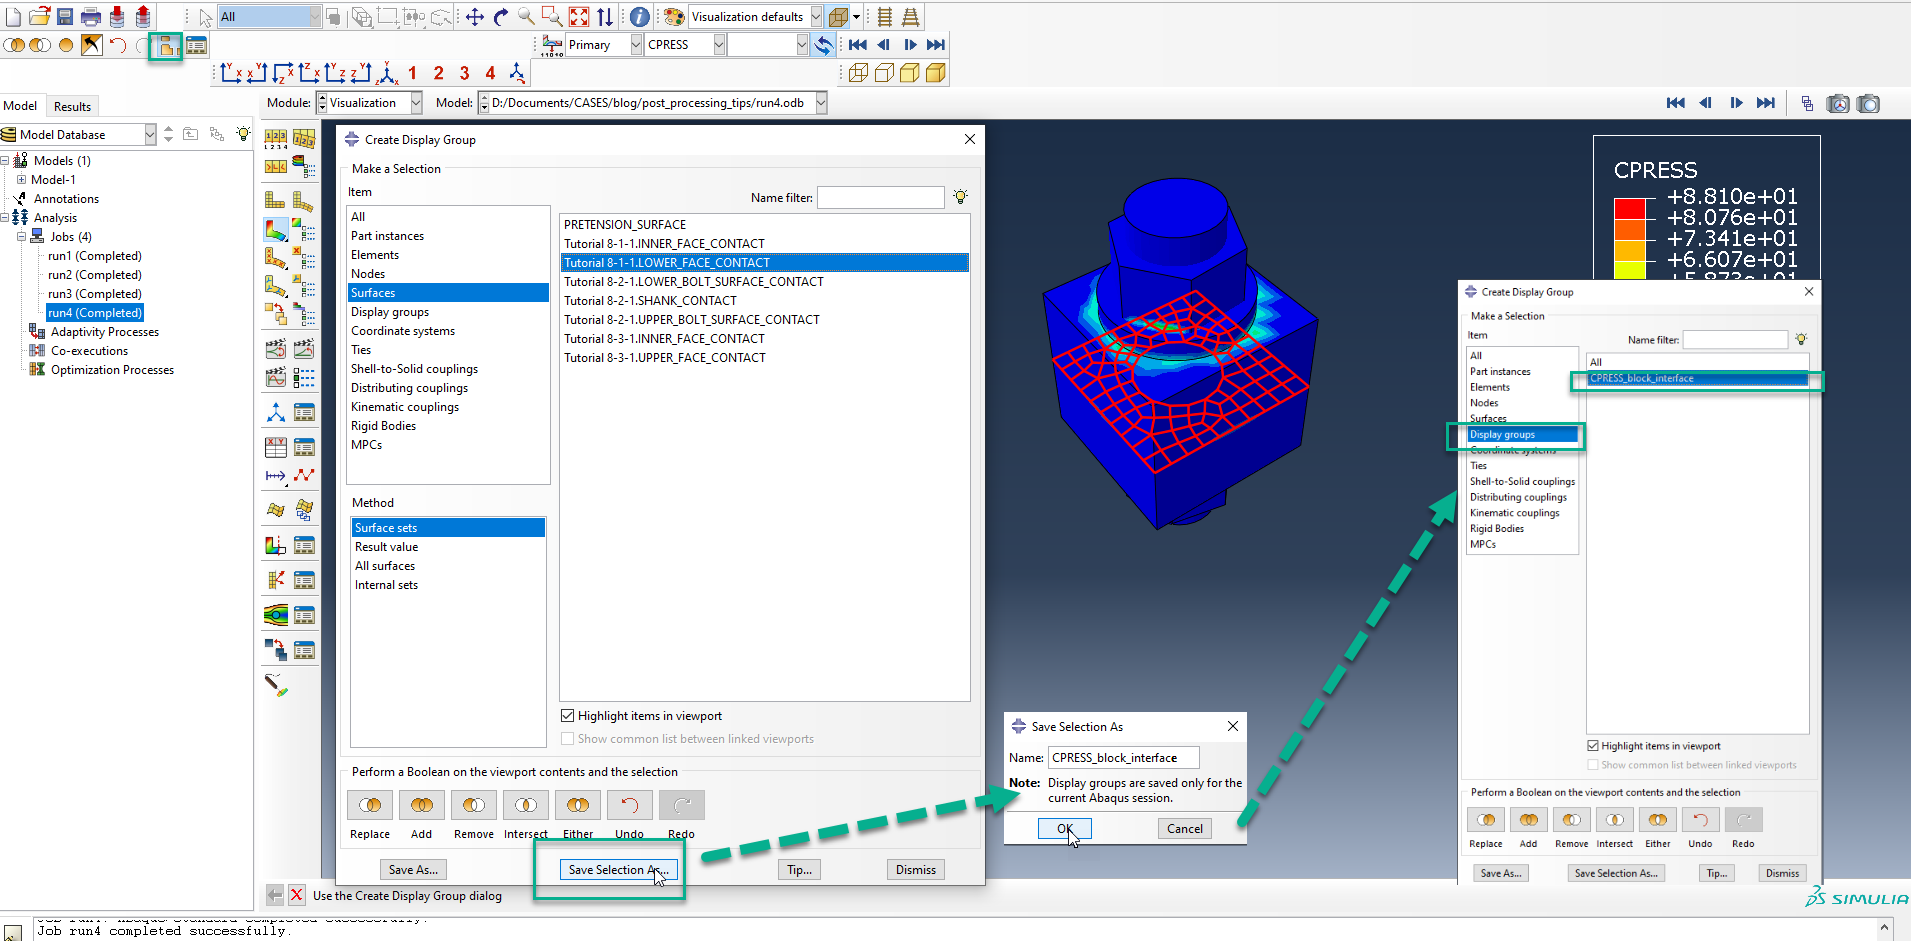
This face will be maintained for results visualization. All of its surrounding entities ( two block instances and one bolt instance) will be made translucent in order to enhance the results visualization. For this particular case, two display groups need to be created. One that will show results and remain opaque (contact face) and another one that will not include results and contain the geometry that will be made translucent. Figures 3 and 4 show the opaque and translucent display groups respectively. The procedure of creating the display groups is also indicated.
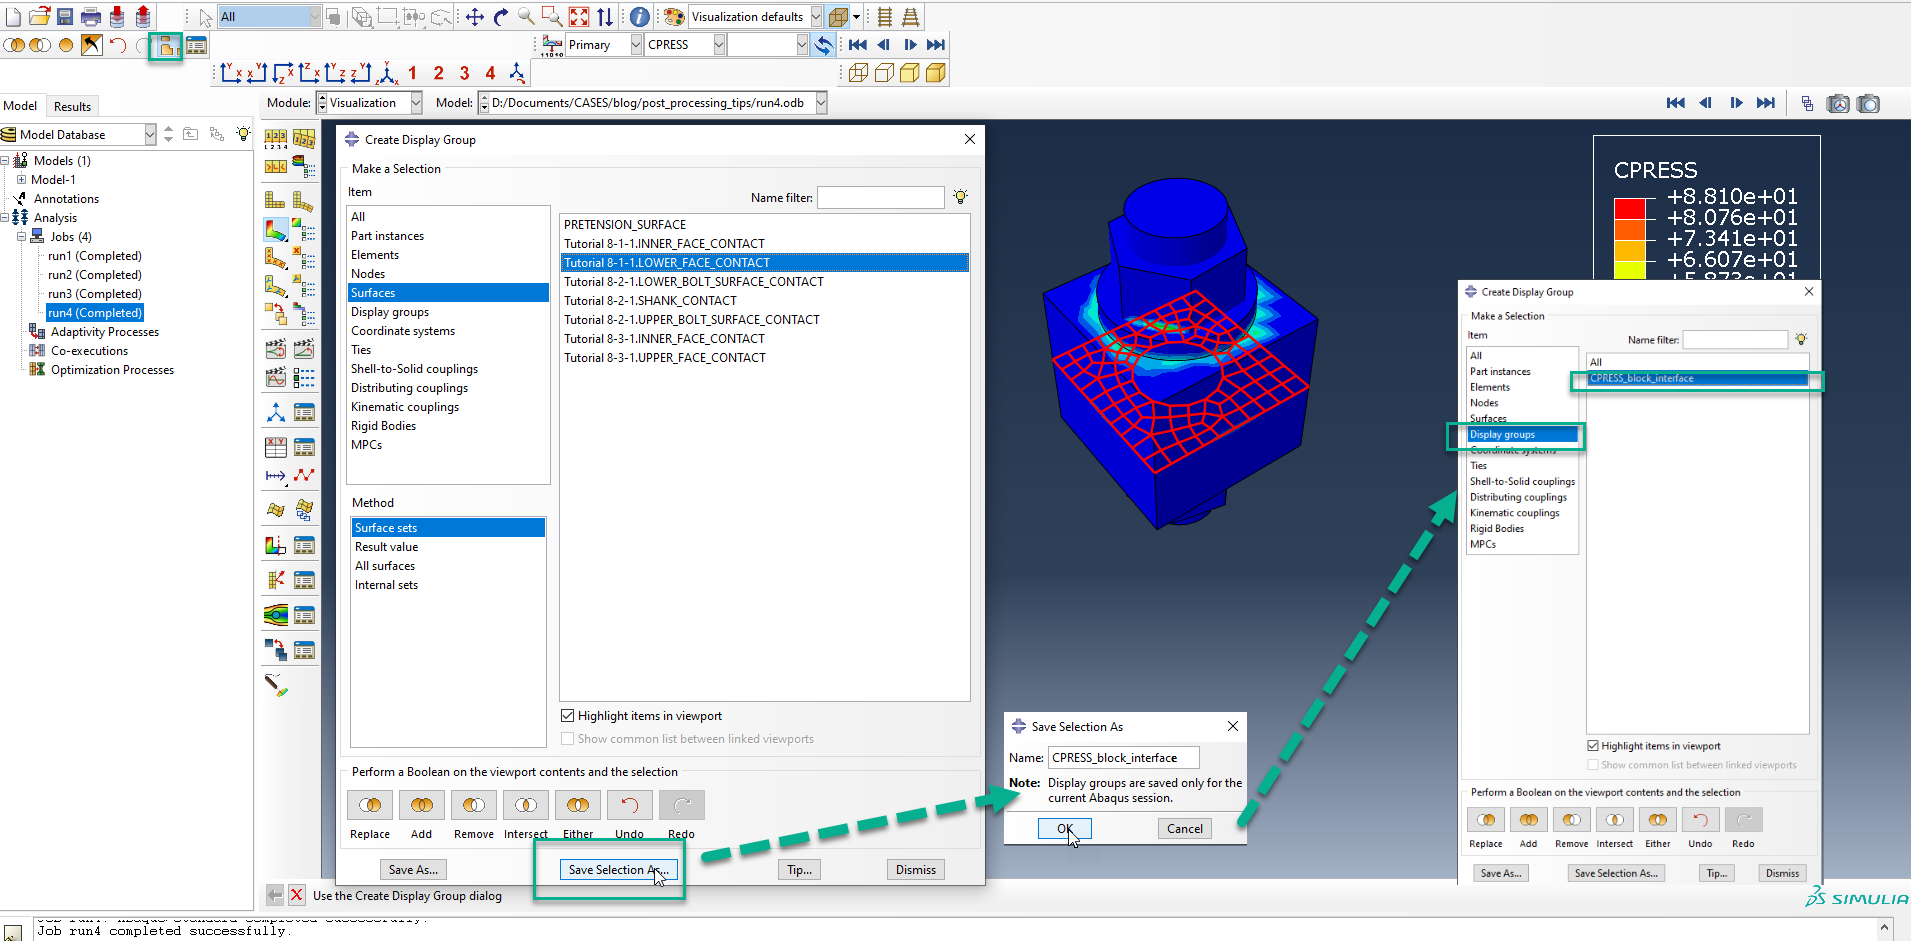
Figure 3: Opaque display group (contact face) for results visualization.
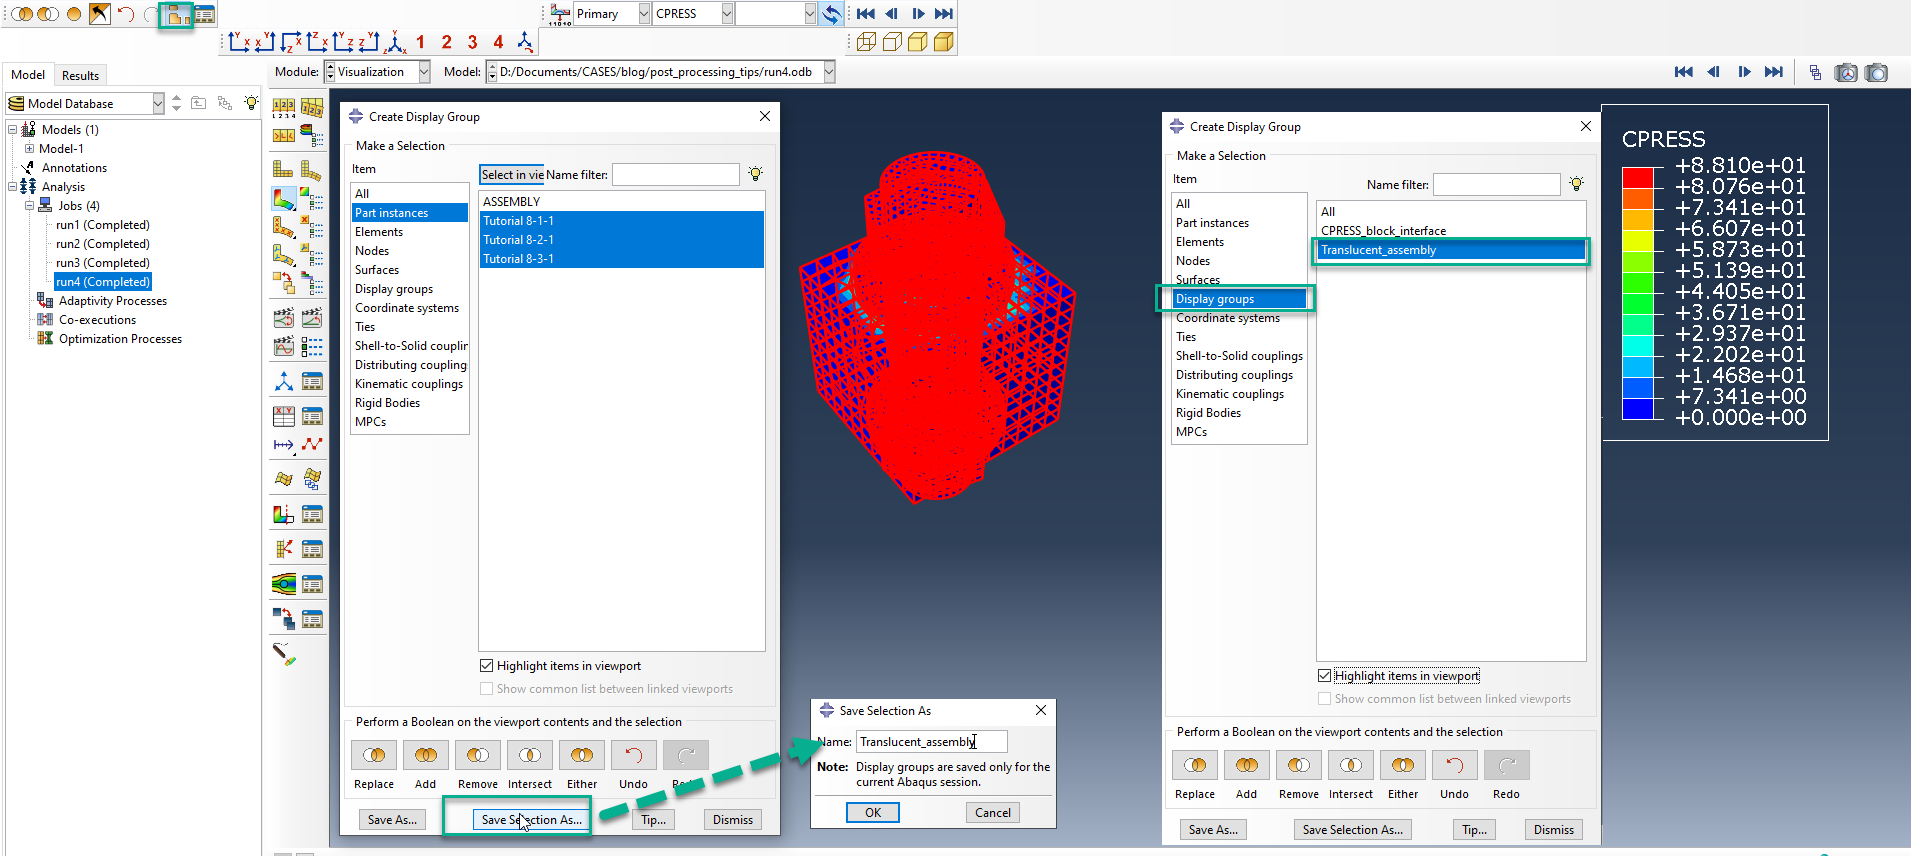
Figure 4: Translucent display group (assembly).
Next, we need to decide on the plot options that we will use for each of the display groups. This can be done sequentially (one display group at a time), by using the display group manager, shown in Figure 5, and the common plot options.
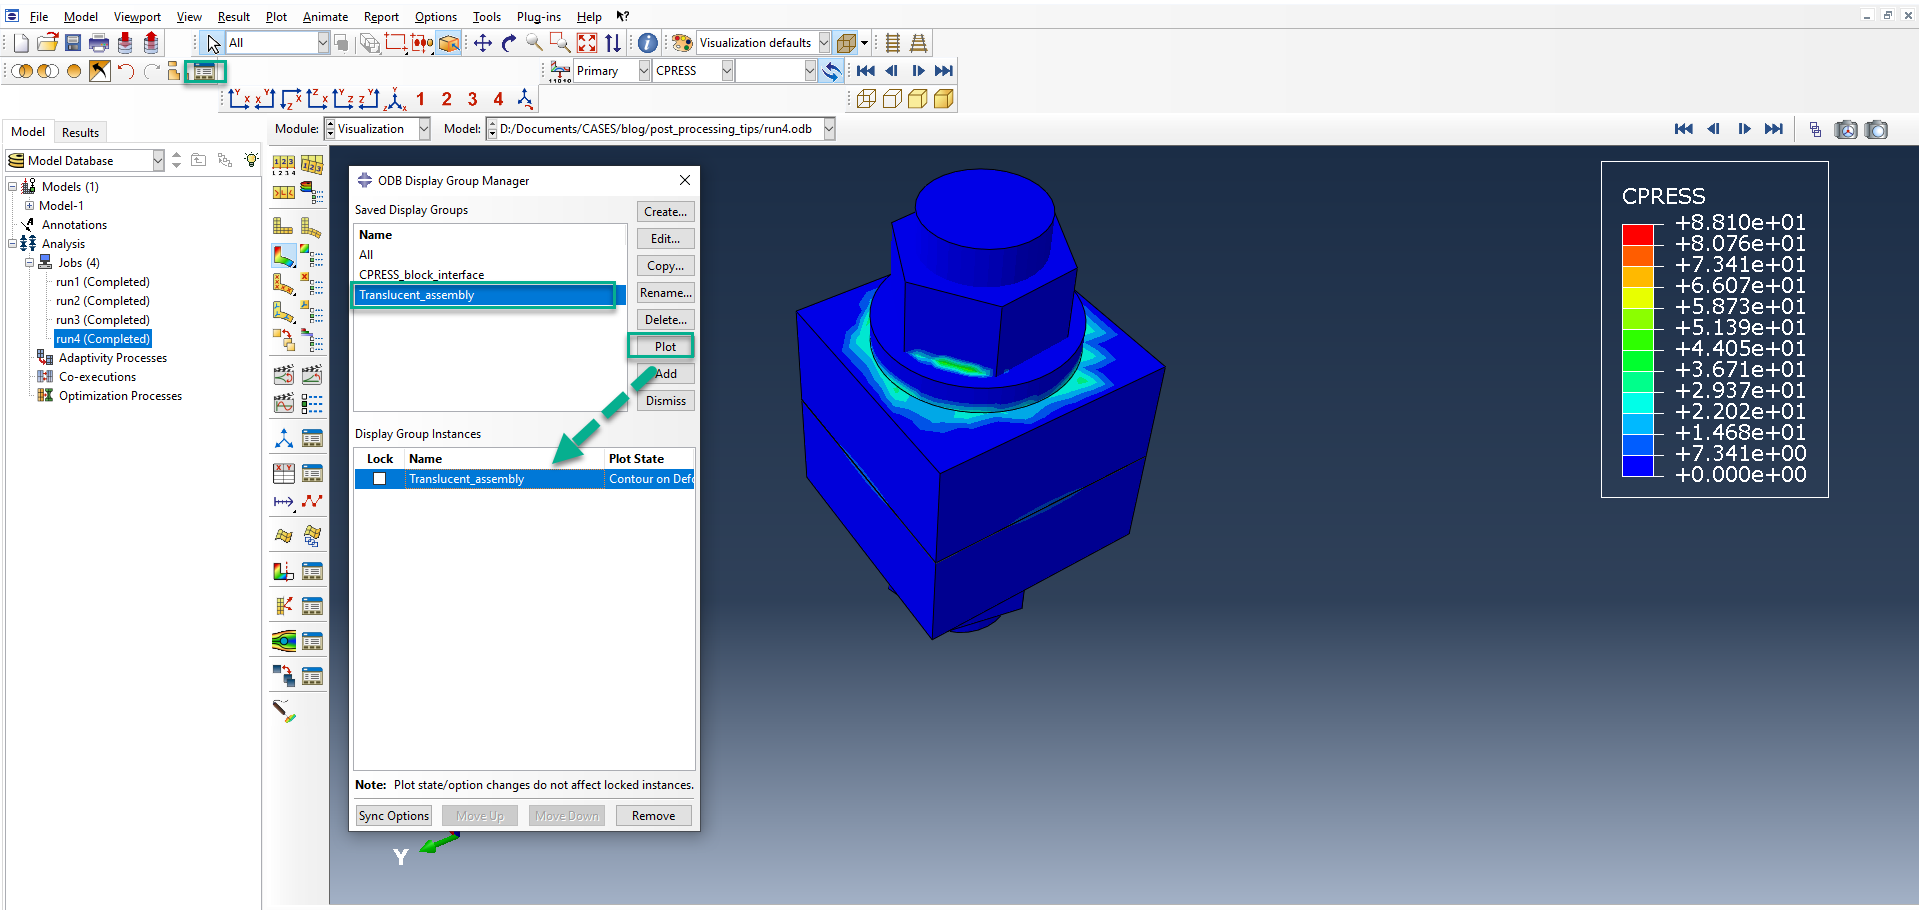
Figure 5: Display groups manager.
Figure 6 shows the procedure for creating the translucent display group. Of course the suggested settings are purely a matter of personal taste, feel free to experiment.
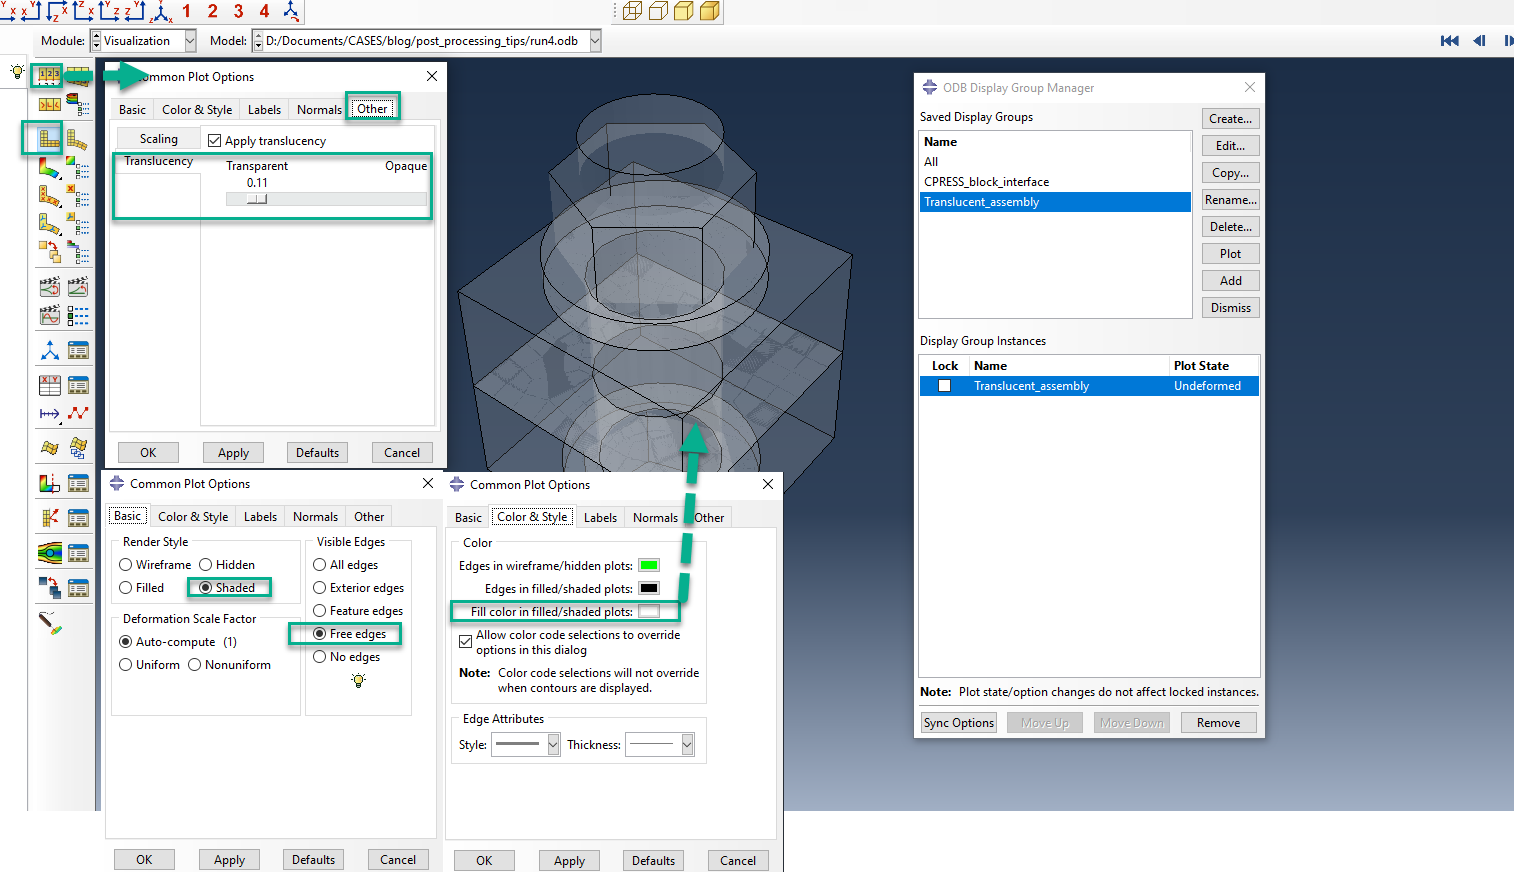
Figure 6:Translucent display group creation.
Figure 7 shows the same procedure for the opaque display group, that will be the region of interest in terms of results presentation. As a small note, remember to freeze ("specify") the upper and lower CPRESS values to avoid unwanted changes in the contour coloring when having both display groups active.
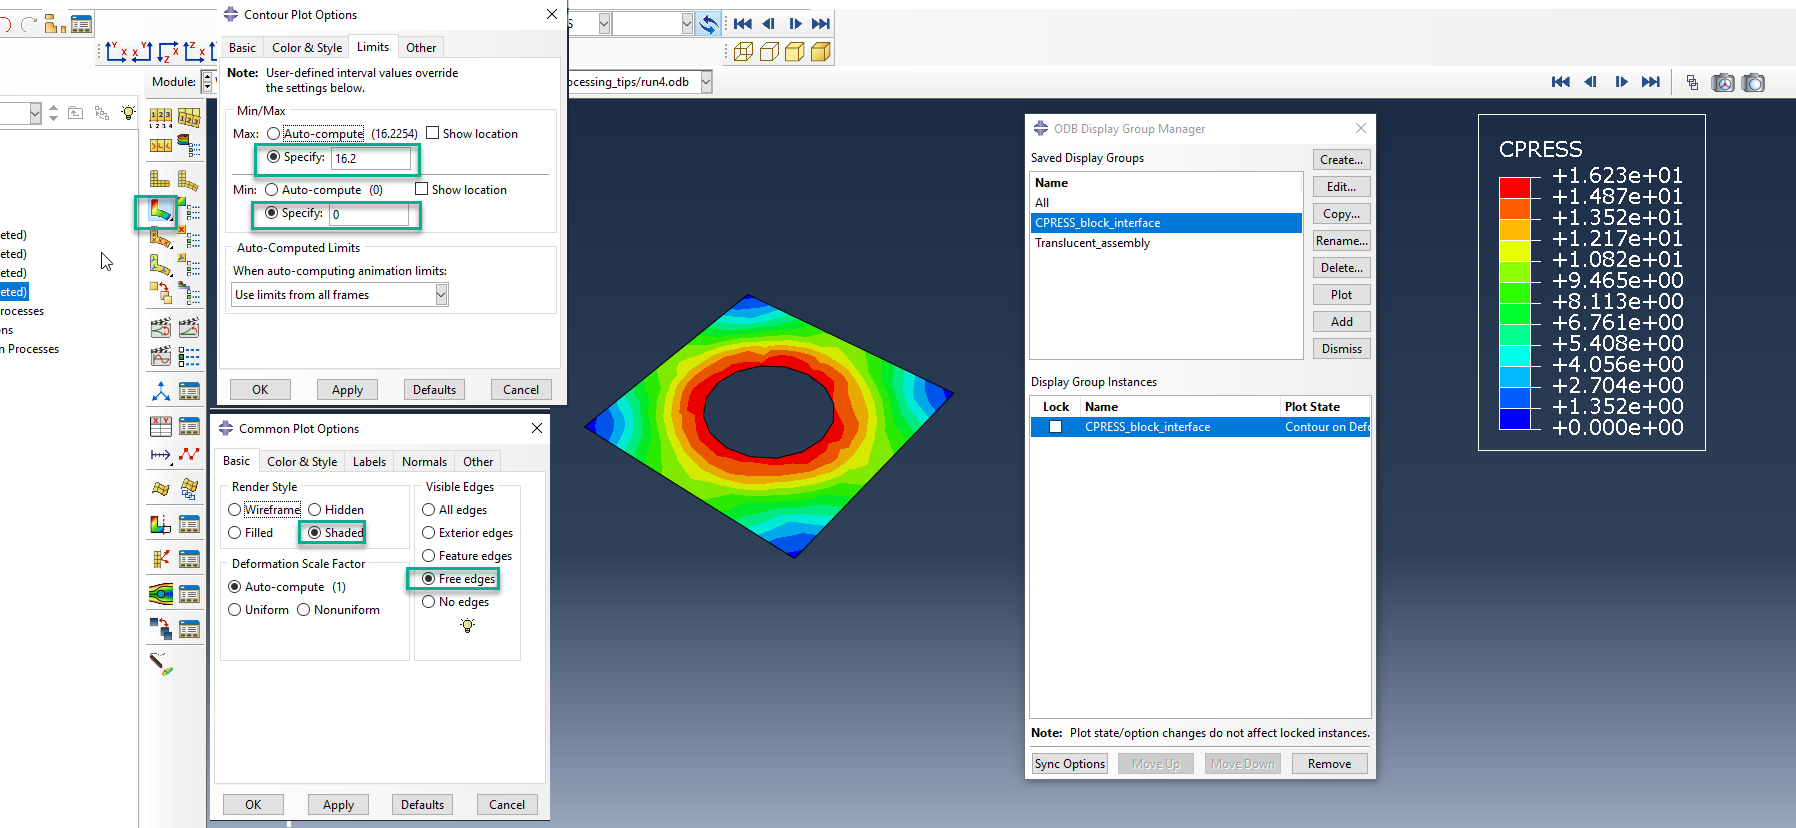
Figure 7:Translucent display group creation.
When you are satisfied with the individual appearance of both groups, you can add them together and lock them if meaningful, in order to prevent visualization changes on those specific groups. This is shown in figure 8.
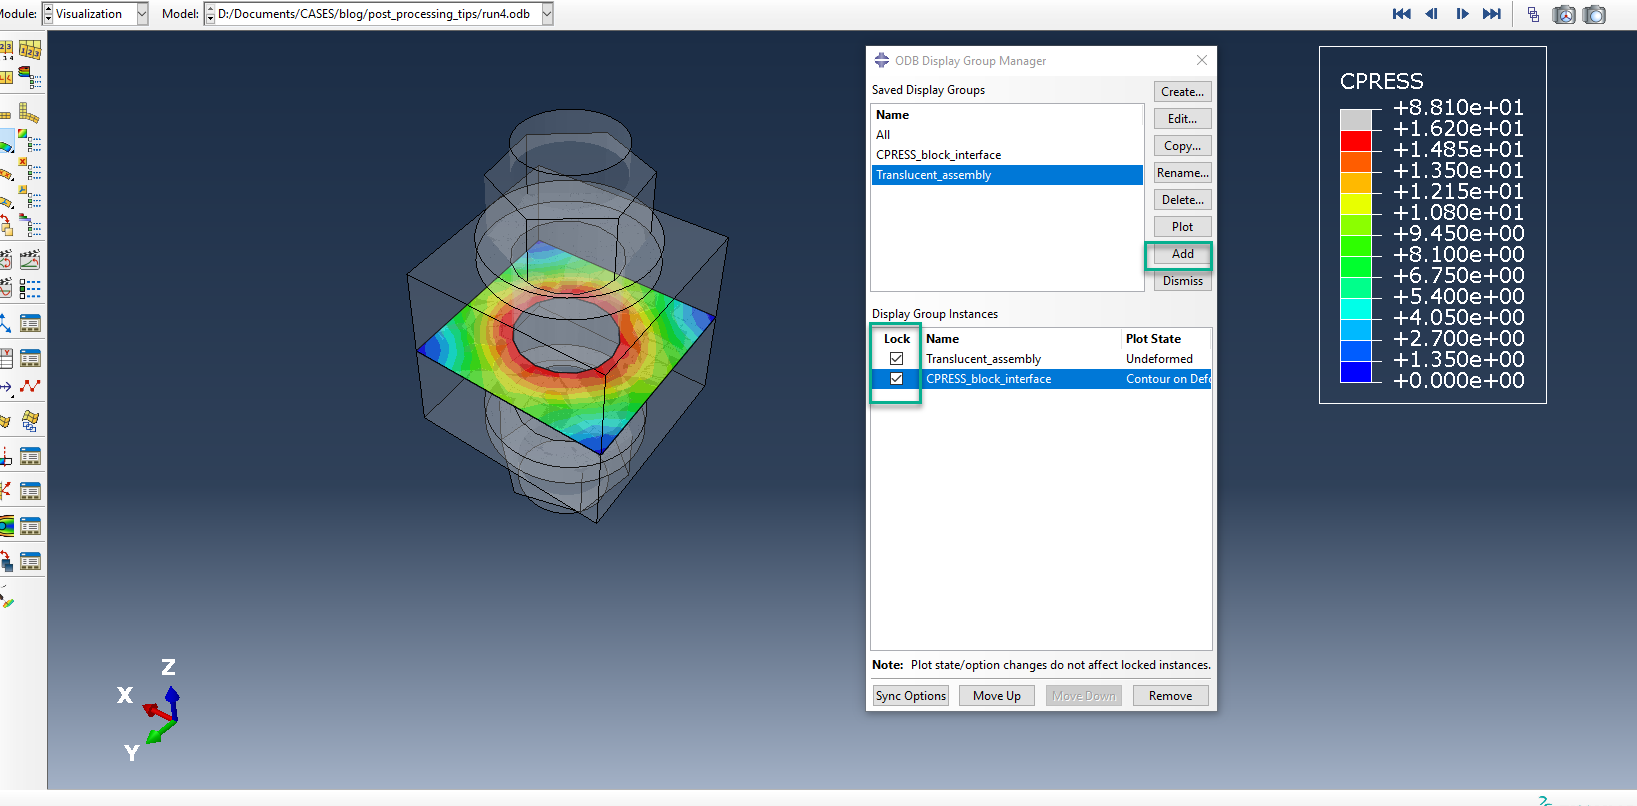
Figure 8: Final state of display groups.
Method 1 for enabling translucency is shown on the following video.
Access From the View Cut Tools
The second option for accesing and enabling the translucency feature , is via the view cut tools. The view cut manager must be used in this case. All the color/translucency settings have been reverted to their default state. Figure 9, shows the procedure of accessing the view cut manager. In order to combine translucent with opaque result-mapped entities, both the above and beyond cut options must be selected. Consequently, the view cut options menu needs to be accessed.
In this particular example we are interested in showing von Mises stress results in MPa for half of the assembly.
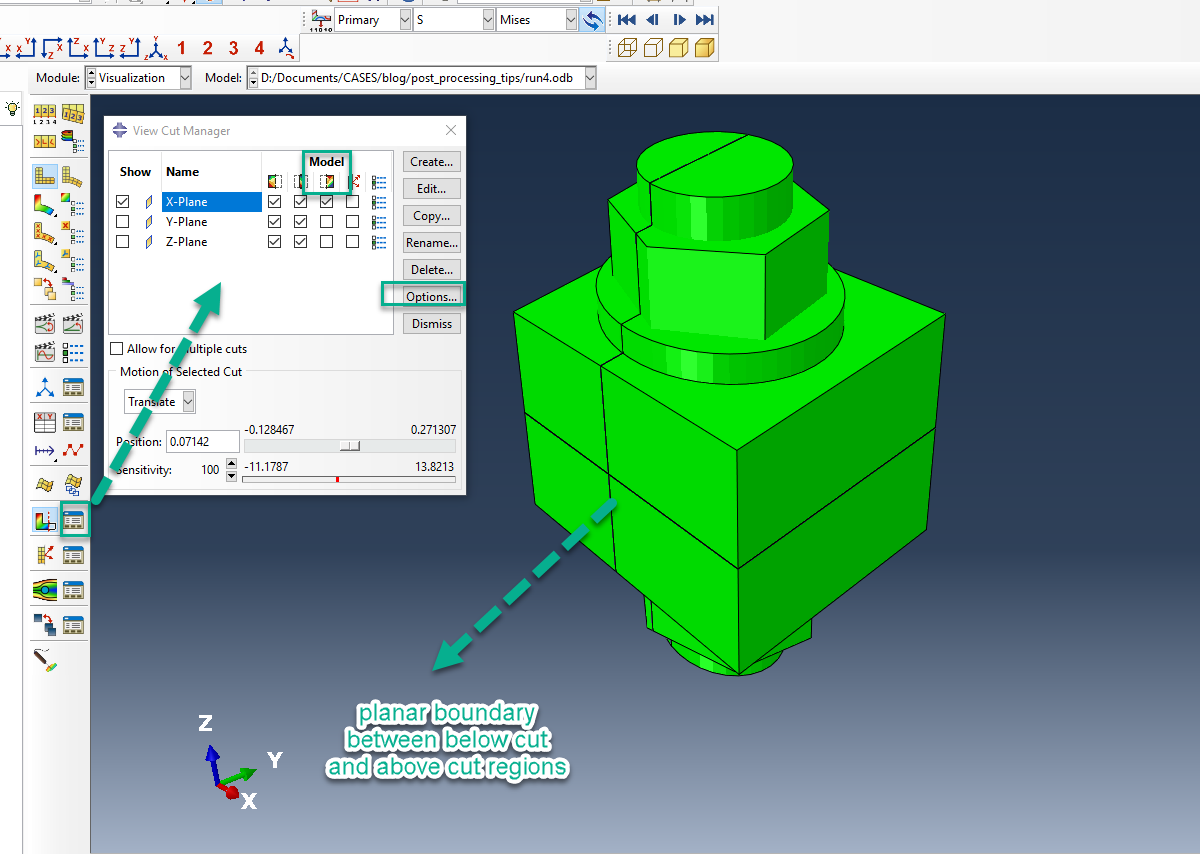
Figure 9: View cut manager settings.
Figure 10 shows the selected settings (color, basic,translucency) for the segment of the assembly that will be made translucent and its placed beyond the cut (+X axis).
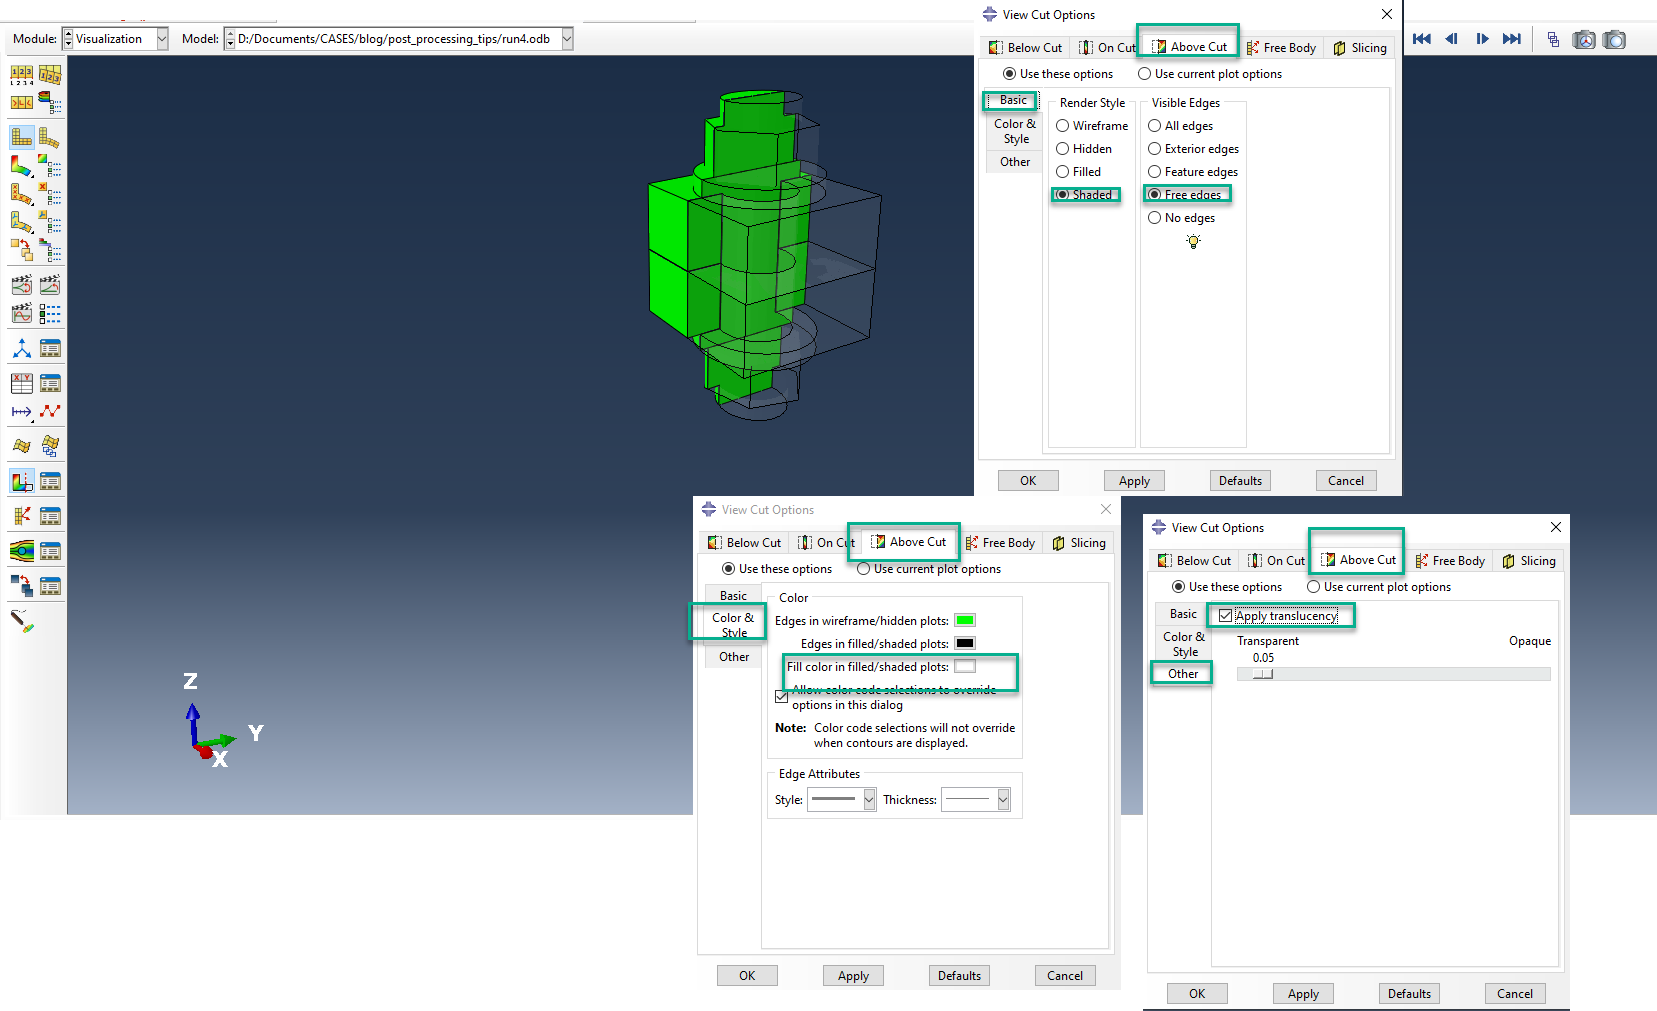
Figure 10: Beyond cut entity visualization settings.
When the settings above have been finalized, based on user preference, all that is left is to plot the result contours of interest. This is shown in Figure 11.
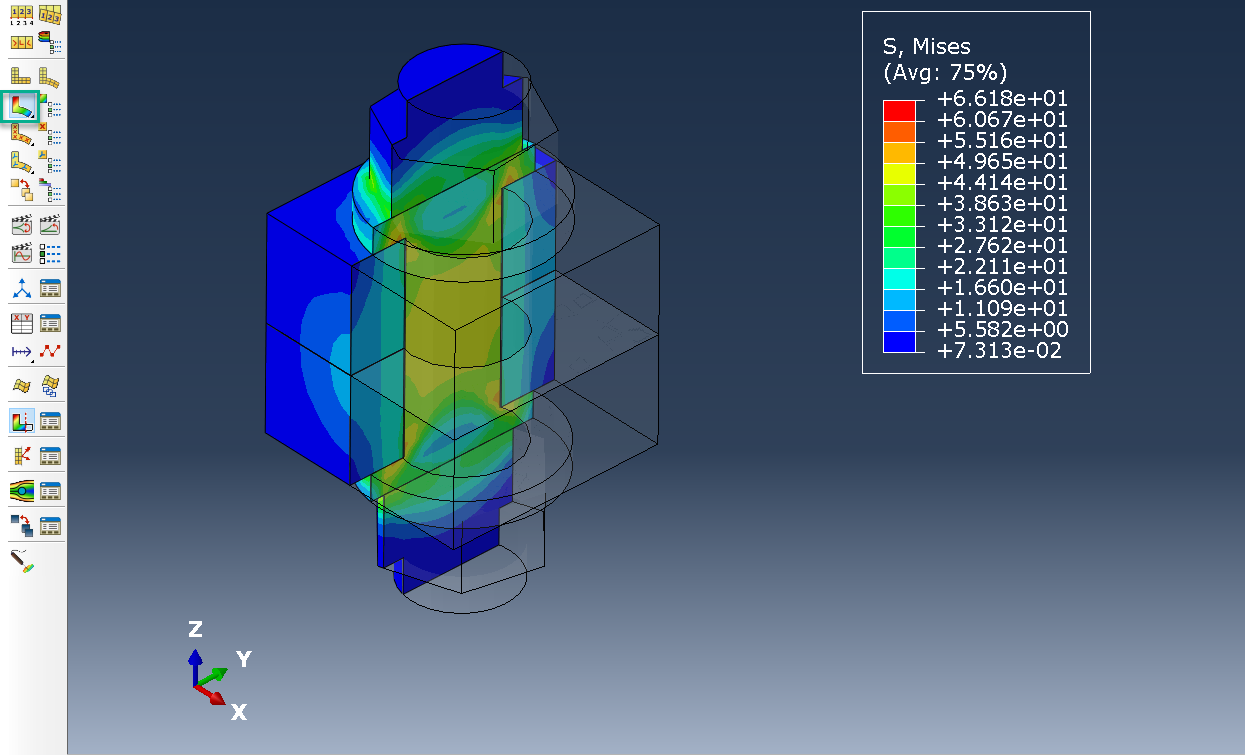
Figure 11: Final state of view cut entities.
Method 2 for enabling translucency is shown on the following video.
Access From the Superimpose Plot Tools
The last way to access the translucency feature in Abaqus visualization is via the superimpose plot options. Figure 12 shows the icons that need to be active in order to achieve this. The intention is to superimpose a deformed shape that will be opaque over an undeformed shape that will be made translucent. In figure 12, since the expected displacements are relatively low I am exaggerating the deformation scale.
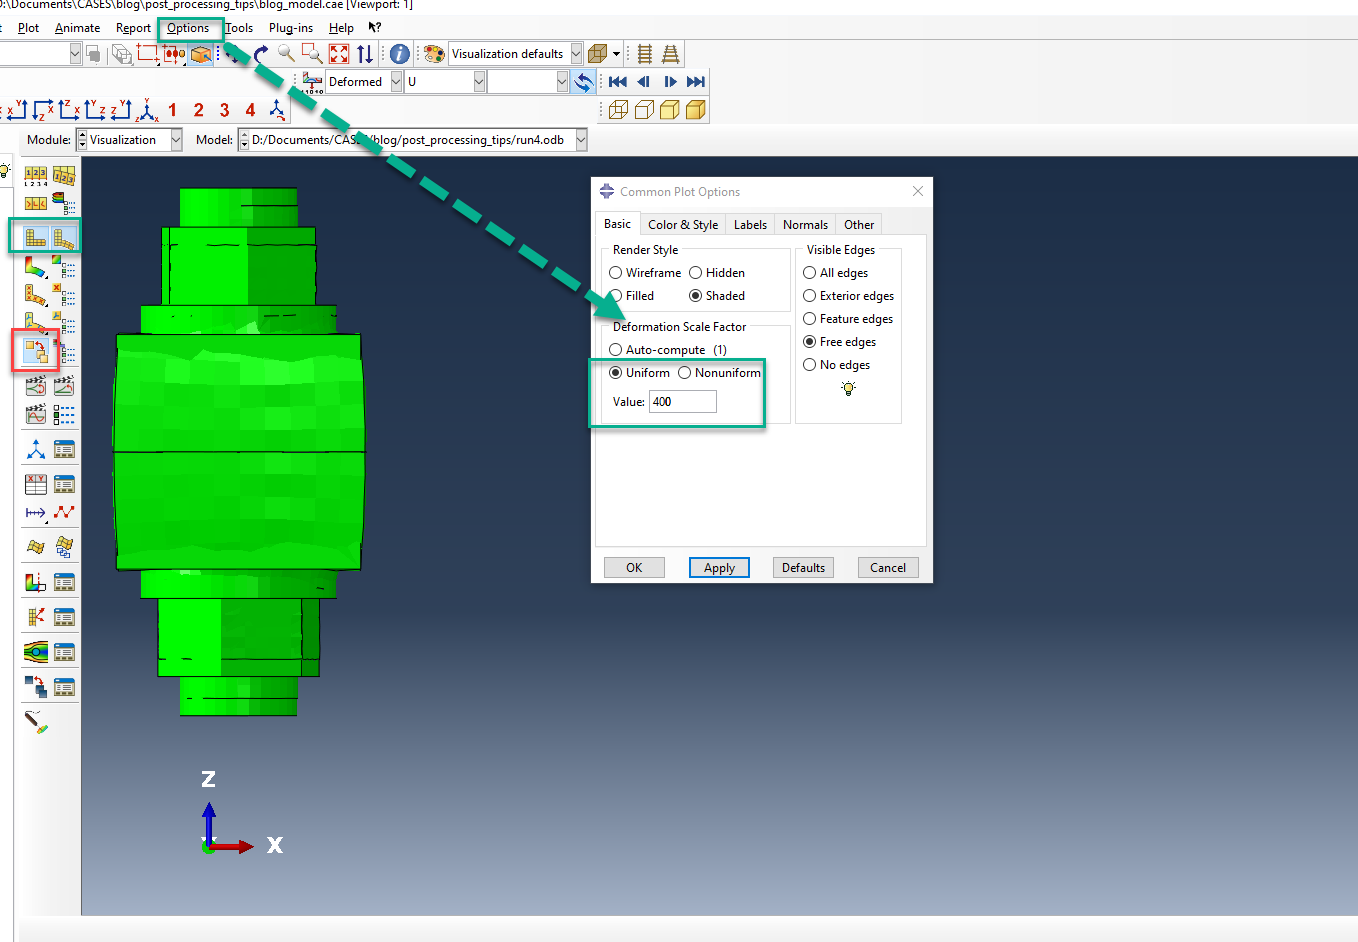
Figure 12: Superimpose tool options.
Figure 13 shows the remaining settings, needed to make the undeformed shape translucent. Additionally in Figure 13, the final state of the assembly is shown, where it is easier to visualize the overall shape of the deformation.
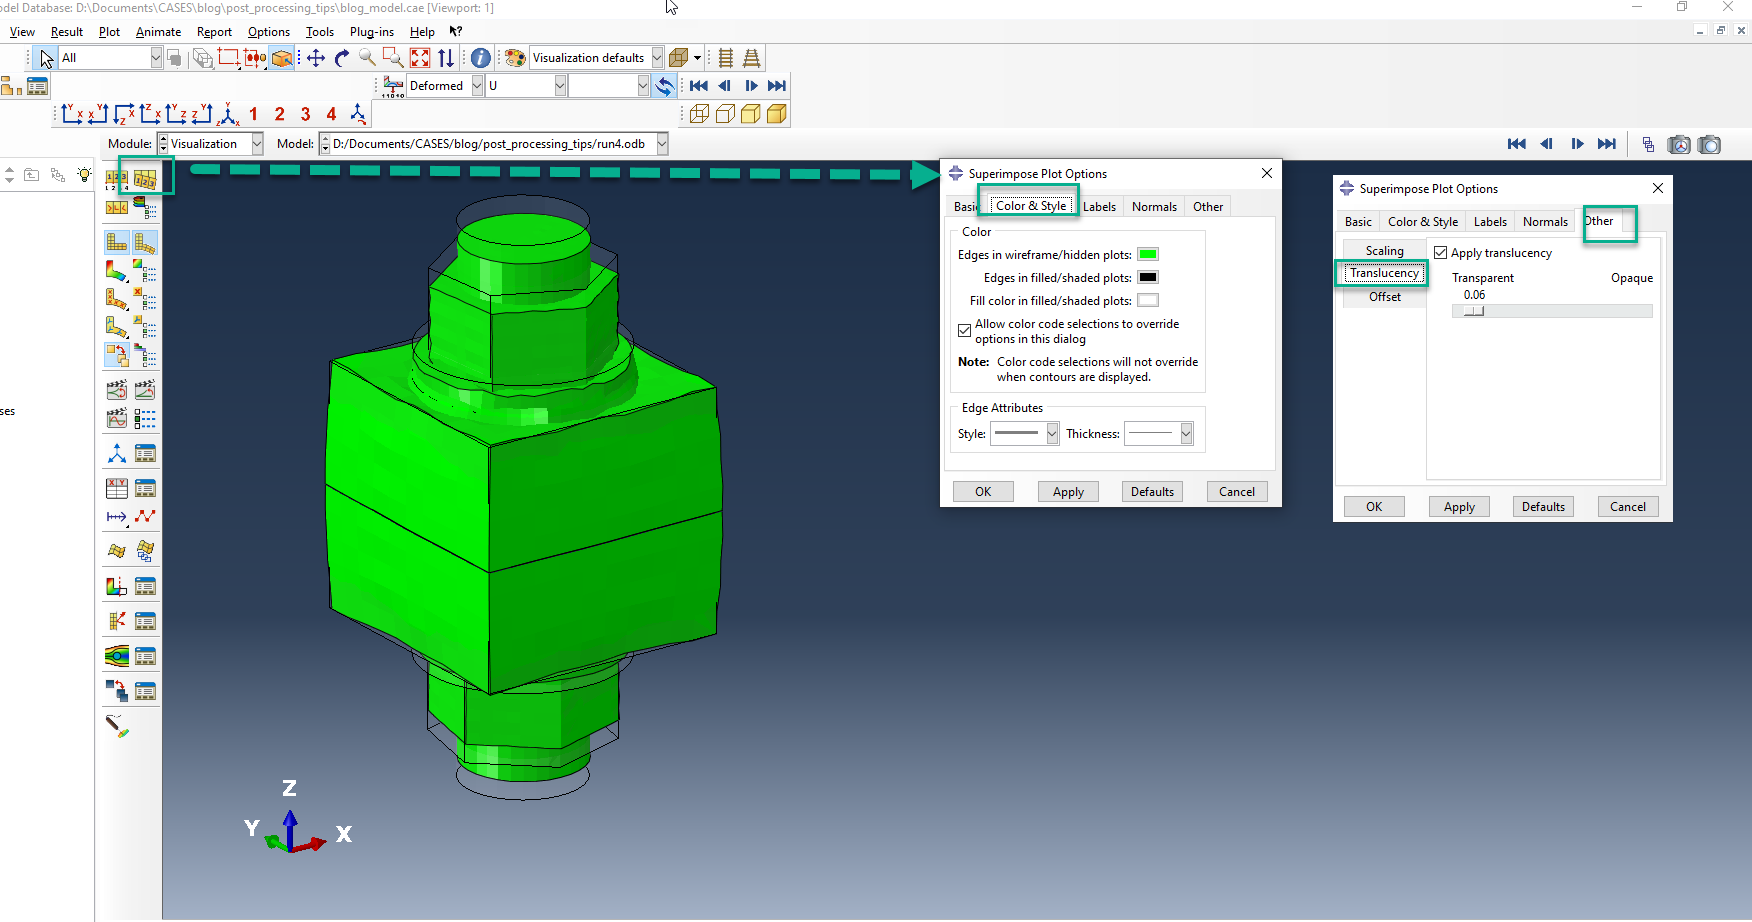
Figure 13: Final state of superimposed entities.
Method 3 for enabling translucency is shown on the following video.

