In this blog post, we will be showing an analysis of a bolted joint. The joint comprises of two flat plates that are made of carbon fiber reinforced polymer material (CFRP). Both plates have the same 8 ply layup (symmetric), and have been modelled with stacked continuum shell elements. Ply failure modelling has been considered in terms of Hashin failure criterion damage initiation and fracture energy damage evolution.
Finite Element Model
Geometry
For the analysis, three part instances in total were used. Two instances for the flat CFRP plate and one instance for the steel bolt. A detail of both geometries, is given below, in Figure 1.

Figure 1 : composite plate geometry (left) and bolt geometry (right) details.
The plate has dimensions of 150x25x3.8 mm (lengthxwidthxthickness) and the M14 bolt has been modelled as one part, having a 0.5mm smaller diameter compared to the hole dimensions.
Material Modeling
Bolt
The bolt material is generic steel with the following linear elastic material properties:
-Young's modulus:210e3 MPa
-Poisson's ratio:0.3
-Density:7850e-12 ton/mm3
Composite plates
The CFRP plates, comprise of several UniDirectional (UD) plies with different orientation with respect to load direction and the plate's length.
A detail from the material editor of the CFRP material, is shown in the Figure 2 below.

Figure 2 : CFRP material modelling detail (elasticity, Hashin damage, fracture energy damage evolution).
Damage Modeling
In order to model CFRP composite damage in Abaqus, you need to combine two modeling aspects. Failure initiation and failure evolution. These components need to both be present, to allow for material degradation.
Alternatively the user, can assess a composite structure as a FAIL/PASS for ply failure , by relying on the first ply failure criteria.
This assessment is the most conservative one, and depends on purely post processing generated failure envelopes according to the available built in first ply criteria. Those criteria do not allow for material degradation or element deletion. More information on these first ply failure criteria can be found on this link.
For this blog, we will be including material degradation (fracture energy damage) in the damage modelling.
Damage initiation is modelled with Hashin ply failure criterion. This criterion considers the following ply failure modes:
-
fiber rupture in tension (Xt)
-
fiber buckling and kinking in compression; (Xc)
-
matrix cracking under transverse tension and shearing; and (Yt)
-
matrix crushing under transverse compression and shearing. (Yc)
Where X and Y refer to the reinforcement and matrix respectively. these four strength values, are provided as input in the respective material tab (second tab from the left) in Figure 2. In the Hashin material window, compressive strength input does not require a "-" sign (which is the case for first ply failure criteria).
Hashin failure initiation criterion is valid for use with plane stress elements. This means that the criterion can be used with plane stress,shell, continuum shell and membrane elements. Continuum 3d solid elements can therefore not be used with Hashin's criterion. If the normal stresses along the thickness of a composite are critical (which would be the case in pressure vessels) then 3d solid continuum elements should be used, together with the LaRC05 damage initiation criterion (that supports using 3d solid continuum elements).
For the damage evolution, energy based damage will be modelled.
The formulation of this model ensures that the energy dissipated during the damage evolution process is equal to the fracture energies (Gf) per direction, as assigned in the respective material window. More information about this model can be found on this link.
Laminate Stacking Sequence (LSS) Definition
Since we are interested in results at the lamina level (mesoscale), we need to provide the LSS for the CFRP plates. This was done via the composite layup section in the Abaqus property module. A detail is shown in the figure below.
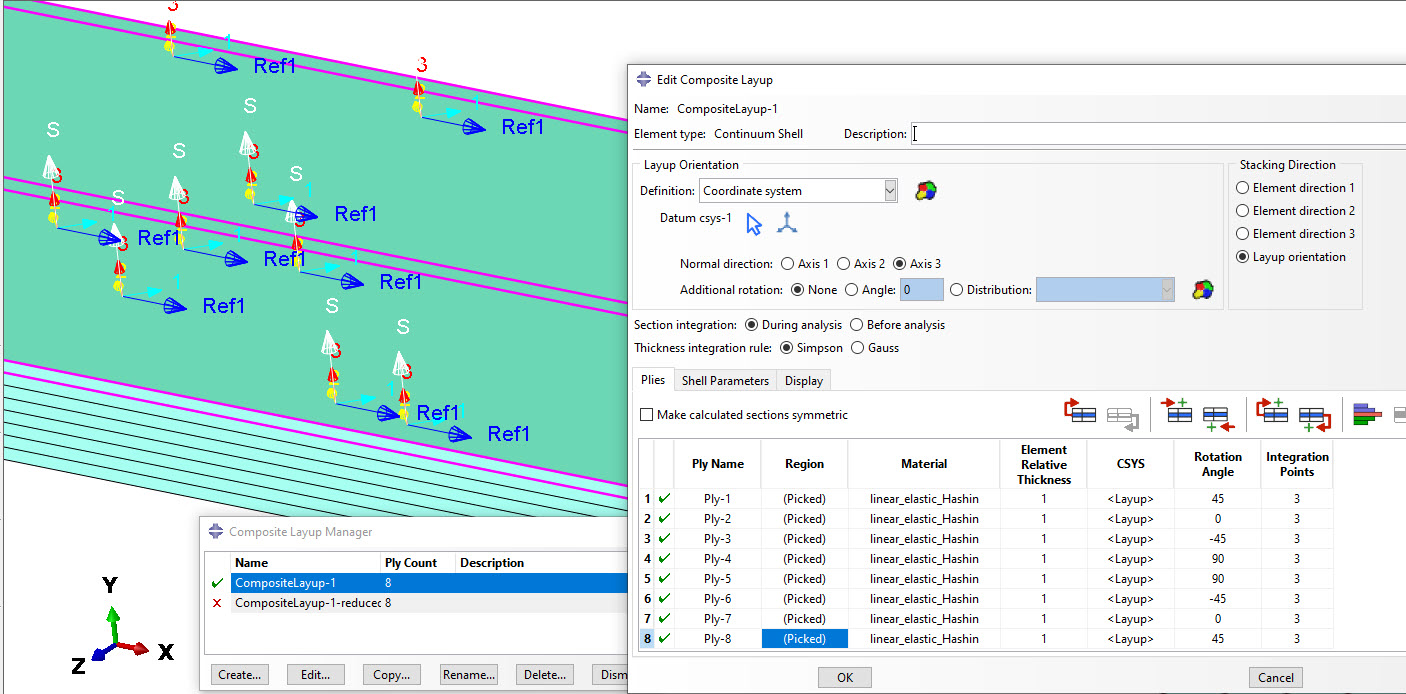
Figure 3 : Laminate Stacking Sequence detail in Composite Layup Window for stacked continuum shells.
A detail of the LSS as it was set up with the Composite layup window is shown above. The composite layup shows a detail of the ply sequence, ply rotation angles (with respect to the reference "Ref1" fiber direction), material and region corresponding to each ply.
Ply-8 is highlighted in Figure 3: The fibers of ply-8 (upper most ply of the laminate) have a 45 degree angle (indicated by the "1" cyan axis) with respect to the reference orientation(indicated by the "Ref1" blue axis). The thickness direction is annotated by the red axis (axis 3) and the LSS stacking direction is indicated by the white colored "S" axis (axis 3 and S should be parallel).
Since the geometry is already partitioned, representing each individual ply (total of 8) , the region assignment should be consistent, in the Composite layup (8 different regions should be chosen).
If you are asking yourselves, why we had to partition the geometry in the first place, keep reading. Please do the same if you are wondering, why we did not use the "Make calculated section symmetric" option, that would only require user input for the four (out of the 8) plies.
Mesh Considerations
Remember, that a lot of the features we are using in this blog, are valid for elements with a plane stress formulation. That having been said, it means that we could choose for either conventional shell modelling (thick shells is the prerequisite here) where no thickness would be modelled in the geometry, or continuum shells that would attain the thickness information, directly from the geometry. The chosen element type was SC8R, which is a first order reduced integration continuum shell element, with a plane stress formulation.
Instead of partitioning the geometry further, we could rely on using a single continuum shell along the thickness, and provide the LSS via the composite layup as normal, which would be the multi-layered section approach. This would have three implications:
1. we would not be able to get interlaminar shear stress output (CTSHR13,CTSHR23) available in the field output per ply. We would only then be able to plot the interlaminar shear stress output via History output requests, by creating a path along the thickness and requesting the results.
By using the stacked continuum shell approach, which we did, this shear stress output per ply is readily available in the Visualization as Field output.
2. The interlaminar shear stress output, which is critical for laminated composites failure, would be less accurately calculated, as we would be using fewer elements along the thickness (of course we can change that with mesh seeding). As a general suggestion, continuum shells are better in capturing those interlaminar stresses compared to both conventional shells and 3d solid continuum shells.
A caveat of the stacked continuum shell approach is that even if the laminate is symmetric, the "Make calculated section symmetric" cannot be used, if we want to have one ply per partition.
Lastly, we need to make sure that the 1,2,3 directions in the material tabs, are correctly aligned with the continuum shell element directions. Those elements are "blind" and need to have the thickness direction explicitly defined.
A detail of the stacking direction of the continuum shells of the plate, are shown in Figure 4 below.
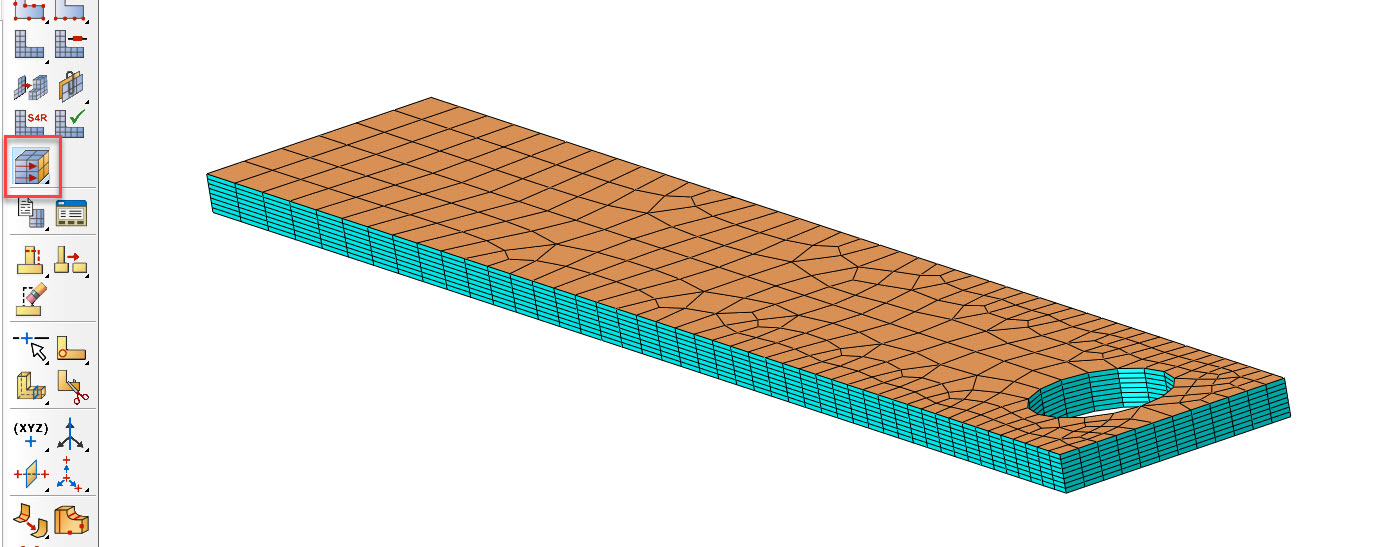
Figure 4 :element stacking direction detail (brown face=top, purple face=plate underside, not shown here).
In Figure 4, we can see that the thickness direction is properly assigned, going from the underside of the plate (not shown) towards the top side of the plate (shown in brown). With this assigned stacking direction, it is easy to confirm that the thickness direction is parallel to the "S" axis of the LSS (Figure 3 above).
For the bolt, C3D8R elements were used. A detail of the assembly's mesh at its initial configuration, is shown below, in Figure 5.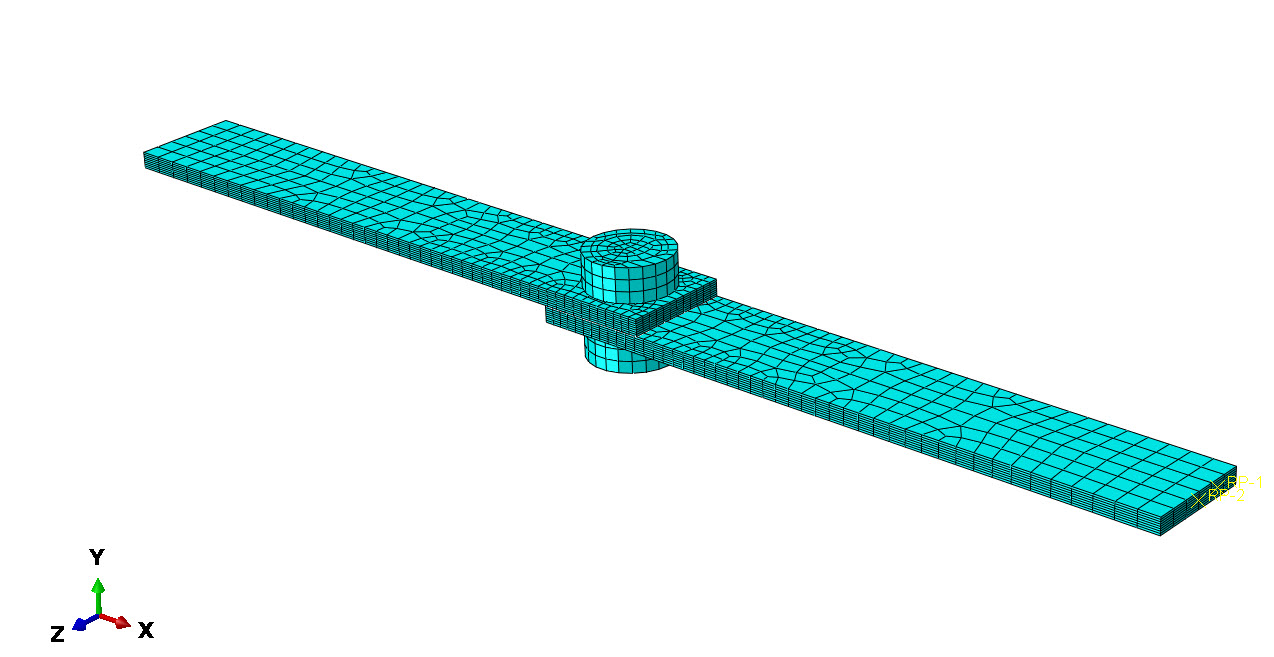
Figure 5 :Bolted joint plate assembly in initial configuration mesh detail.
Interactions, Loads and Bcs, Analysis Steps
In terms of contact interaction, contact with friction (μ=0.1) was used for bolt to plate and plate to plate contact. The exception were the two bolt faces in direct contact with the plates. As pretensioned would be applied there, a higher friction coefficient(μ=0.3) was used.
A detail of the Loads/BCs is shown in Figure 6 below.
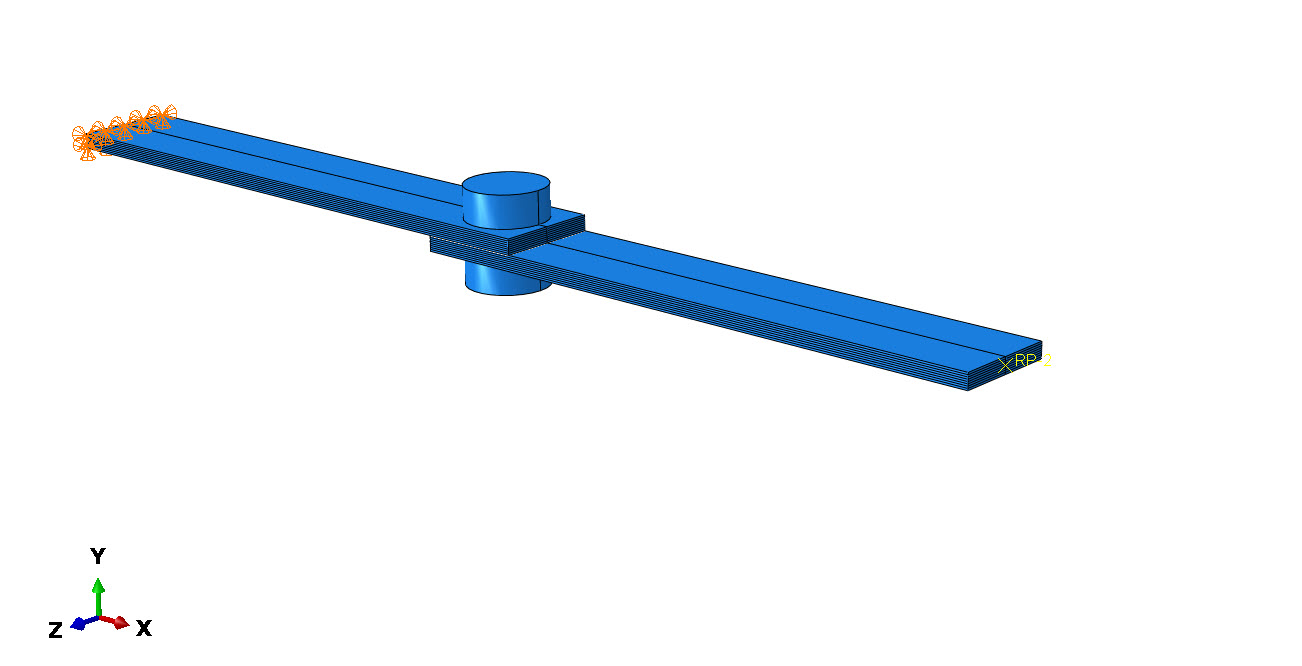
Figure 6 :Loads and boundary conditions detail.
The left end of the upper plate, was fully constrained. In a first analysis step, a certain bolt pretension load (100 N) was applied, to clamp the plate faces together. Then in a second step, a +X displacement was applied on the right end face of the lower plate. This displacement, was imposed via an RP (Figure 6) that was coupled to the respective end face, and allowed for acquiring total reaction force results, on that end face. During the displacement controlled step, the bolt load was set to "Fix at current length".
Results
Various results will be shown as images. At the end of the post, a representative results' video will also be included.
Stress results
Interlaminar shear stress results for the lower plate, are shown in the Figures below. As mentioned you can directly visualize these results via Field output, per ply, if you also use the stacked continuum shell approach. Alternatively you can decide to plot those via XY data, if another modelling strategy is preferred.
Below, Figure 7, shows the interlaminar shear stresses (CTSHR13, CTSHR23) for the first -45 ply (ply -6). The fiber orientation of ply 6 is shown to the right hand side of Figure 7.
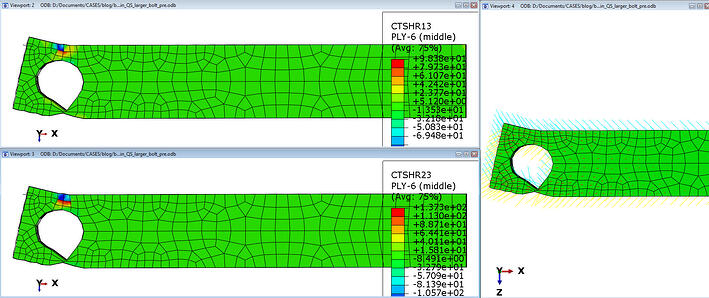
Figure 7 :Interlaminar shear stresses (CTSHR13, CTSHR23, in MPa) for the first -45 ply of the bottom plate.
Figure 8, shows an envelope plot (useful when elements with a plane stress formulation are used) of the von Mises stress on the composite plates. The envelope plot will allow the user todirectly visualize the max results values in regions of interest, instead of scanning through the per ply results (which are also available of course).
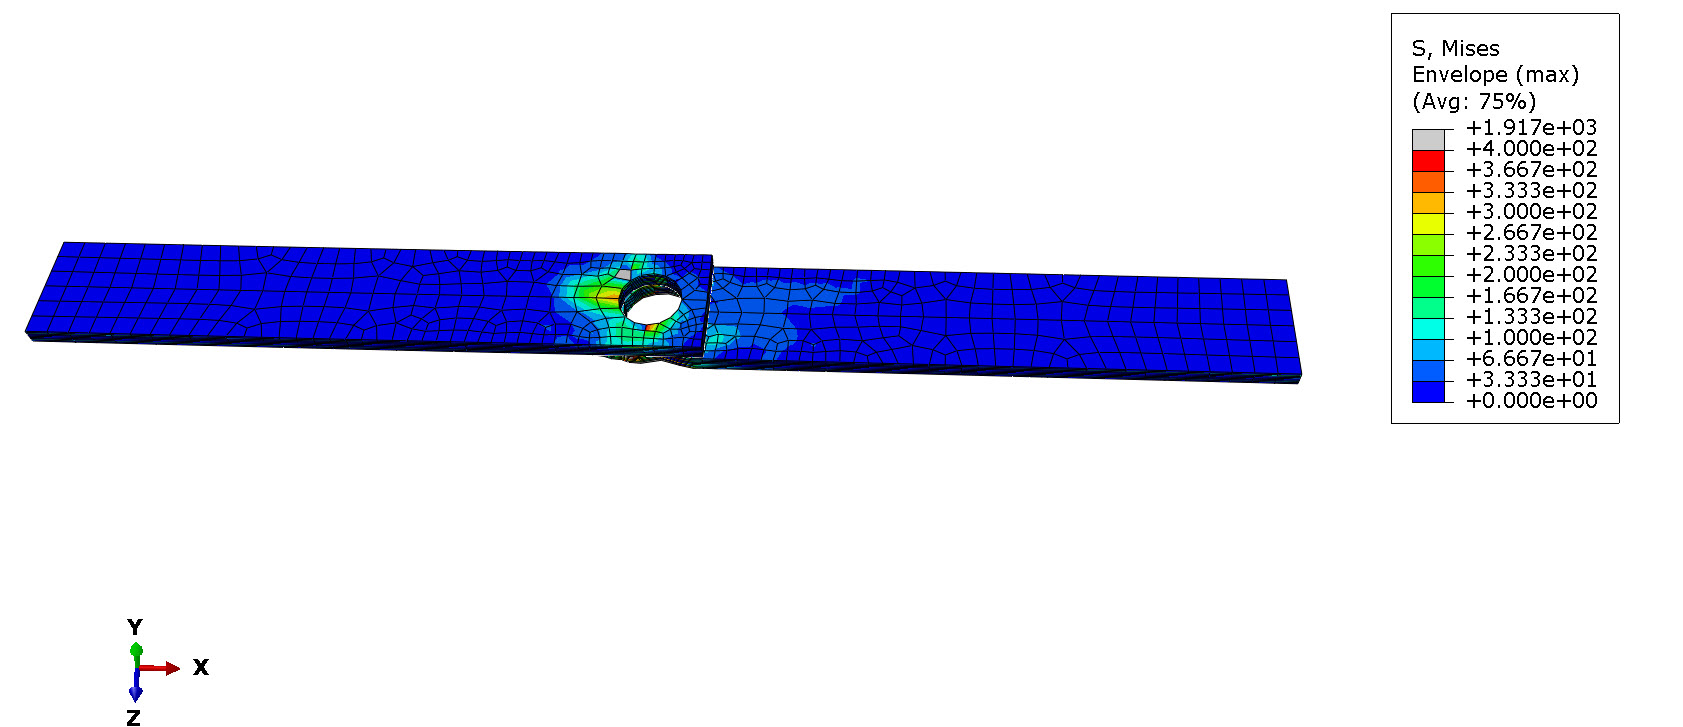
Figure 8: von Mises stress results (MPa) envelope for the plates.
Displacement/Deformed Shape Results
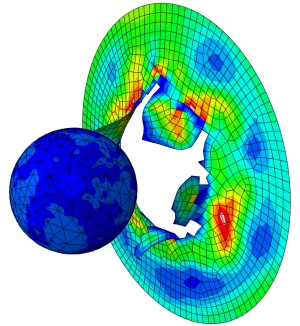
Figure 9 below, shows the displacement magnitude results for the bolted joint assembly in mm. The lower side of Figure 9, shows the overlay of the lower plate in its damaged state (green color) against its initial undeformed shape (see through). The material degradation is evident for the lower plate.
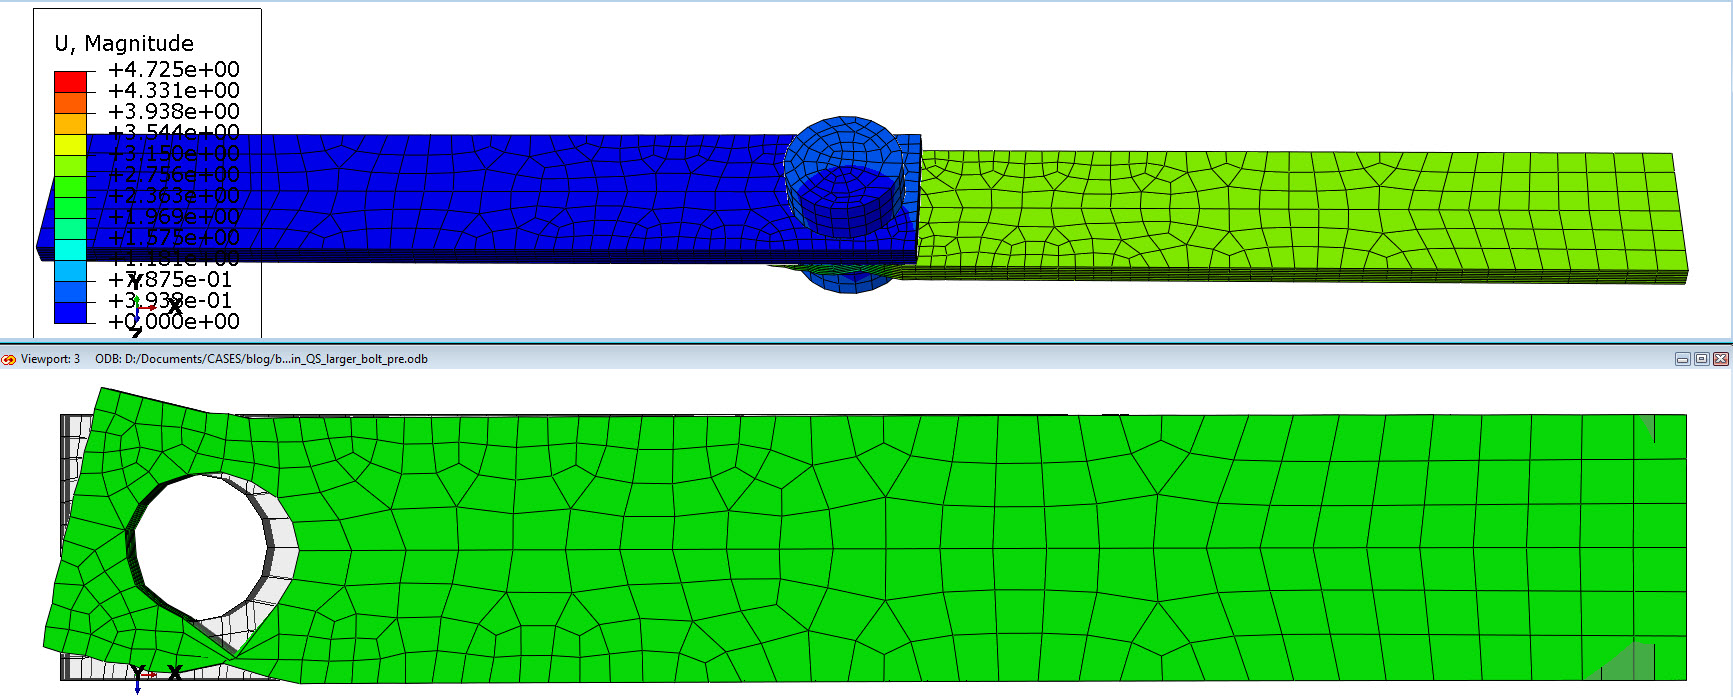
Figure 9 :Displacement magnitude results (top- in mm) and deformed vs undeformed shape comparison (bottom).
Damage Related Results
In order to assess the modelled damage features (Hashin initiation+ fracture energy damage evolution), certain Field output needs to be requested by the user. For Hashin, every different ply failure mode gets a separate output. The relevant outputs are given below:
-HSNFTCRT
-HSNFCCRT
-HSNMTCRT
-HSNMCCRT
Wherein FT,FC,MT,MC correspond to Fiber Tension, Fiber Compression, Matrix Tension and Matrix Compression respectively.
Those output variables will only show the regions wherein damage has initiated (damage=value of 1).
Figure 10 shows details from various plies where fiber damage has initiated. The top plot, shows the fiber tensile damage initiation of ply 2 and the bottom contour plot, the fiber compressive damage initiation of ply 4.
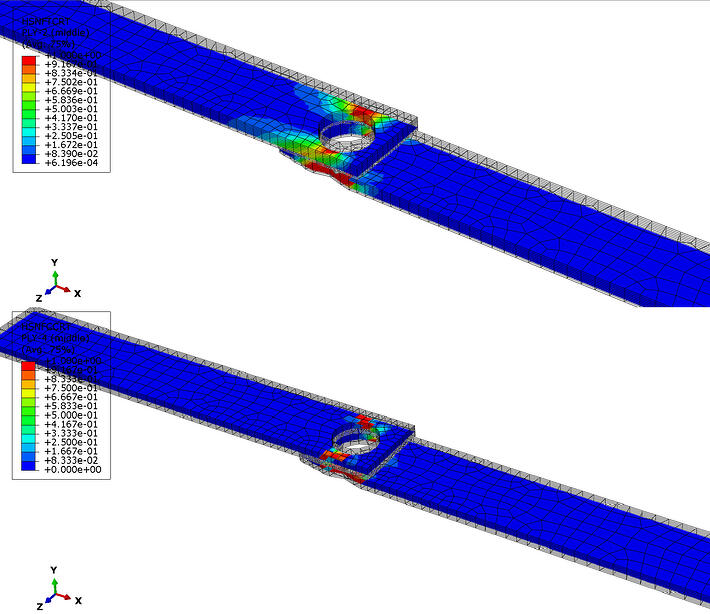
Figure 10 :Hashin criterion damage initiation for tensile (top-ply 2) and compressive (bottom-ply 4) fiber damage.
Figure 11 shows details from various plies where matrix damage has initiated. The top plot, shows the matrix tensile damage initiation of ply 2 and the bottom contour plot, the fiber compressive damage initiation of ply 4.
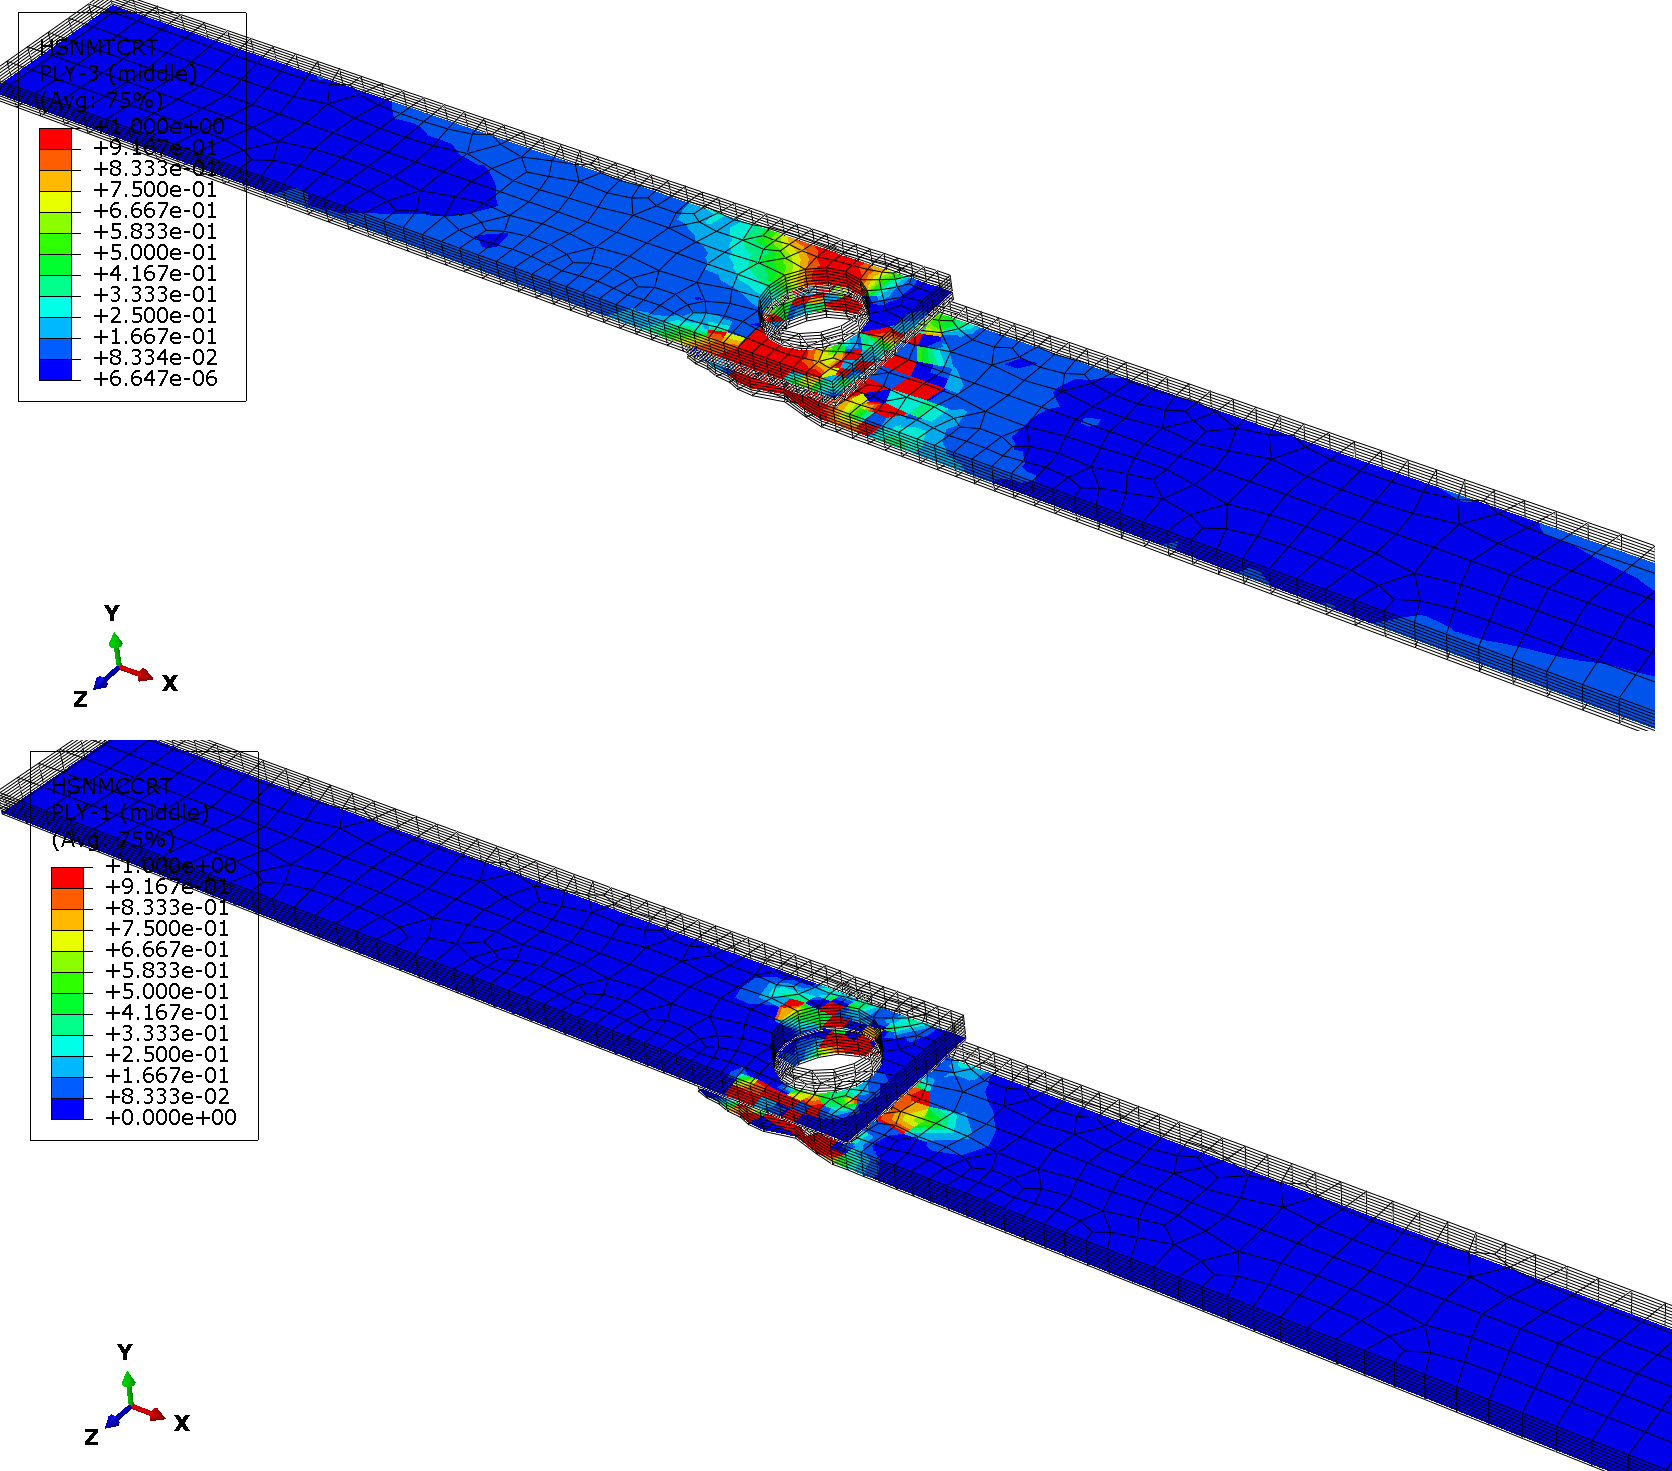
Figure 11 :Hashin criterion damage initiation for tensile (top - ply 3) and compressive (bottom- ply 1) matrix damage.
Damage evolution requires specific field output request, similar to Hashin damage.
The relevant outputs are given below:
-DAMAGEFT
-DAMAGEFC
-DAMAGEMT
-DAMAGEFC
Where the bold letters, indicate the respective fiber and matrix failure modes, similar to the Hashin related output.
Exemplary per ply contour plots, for the above damage variables are given in Figure 12 below. Those relate to fiber damage evolution, for tension and compression failure modes.
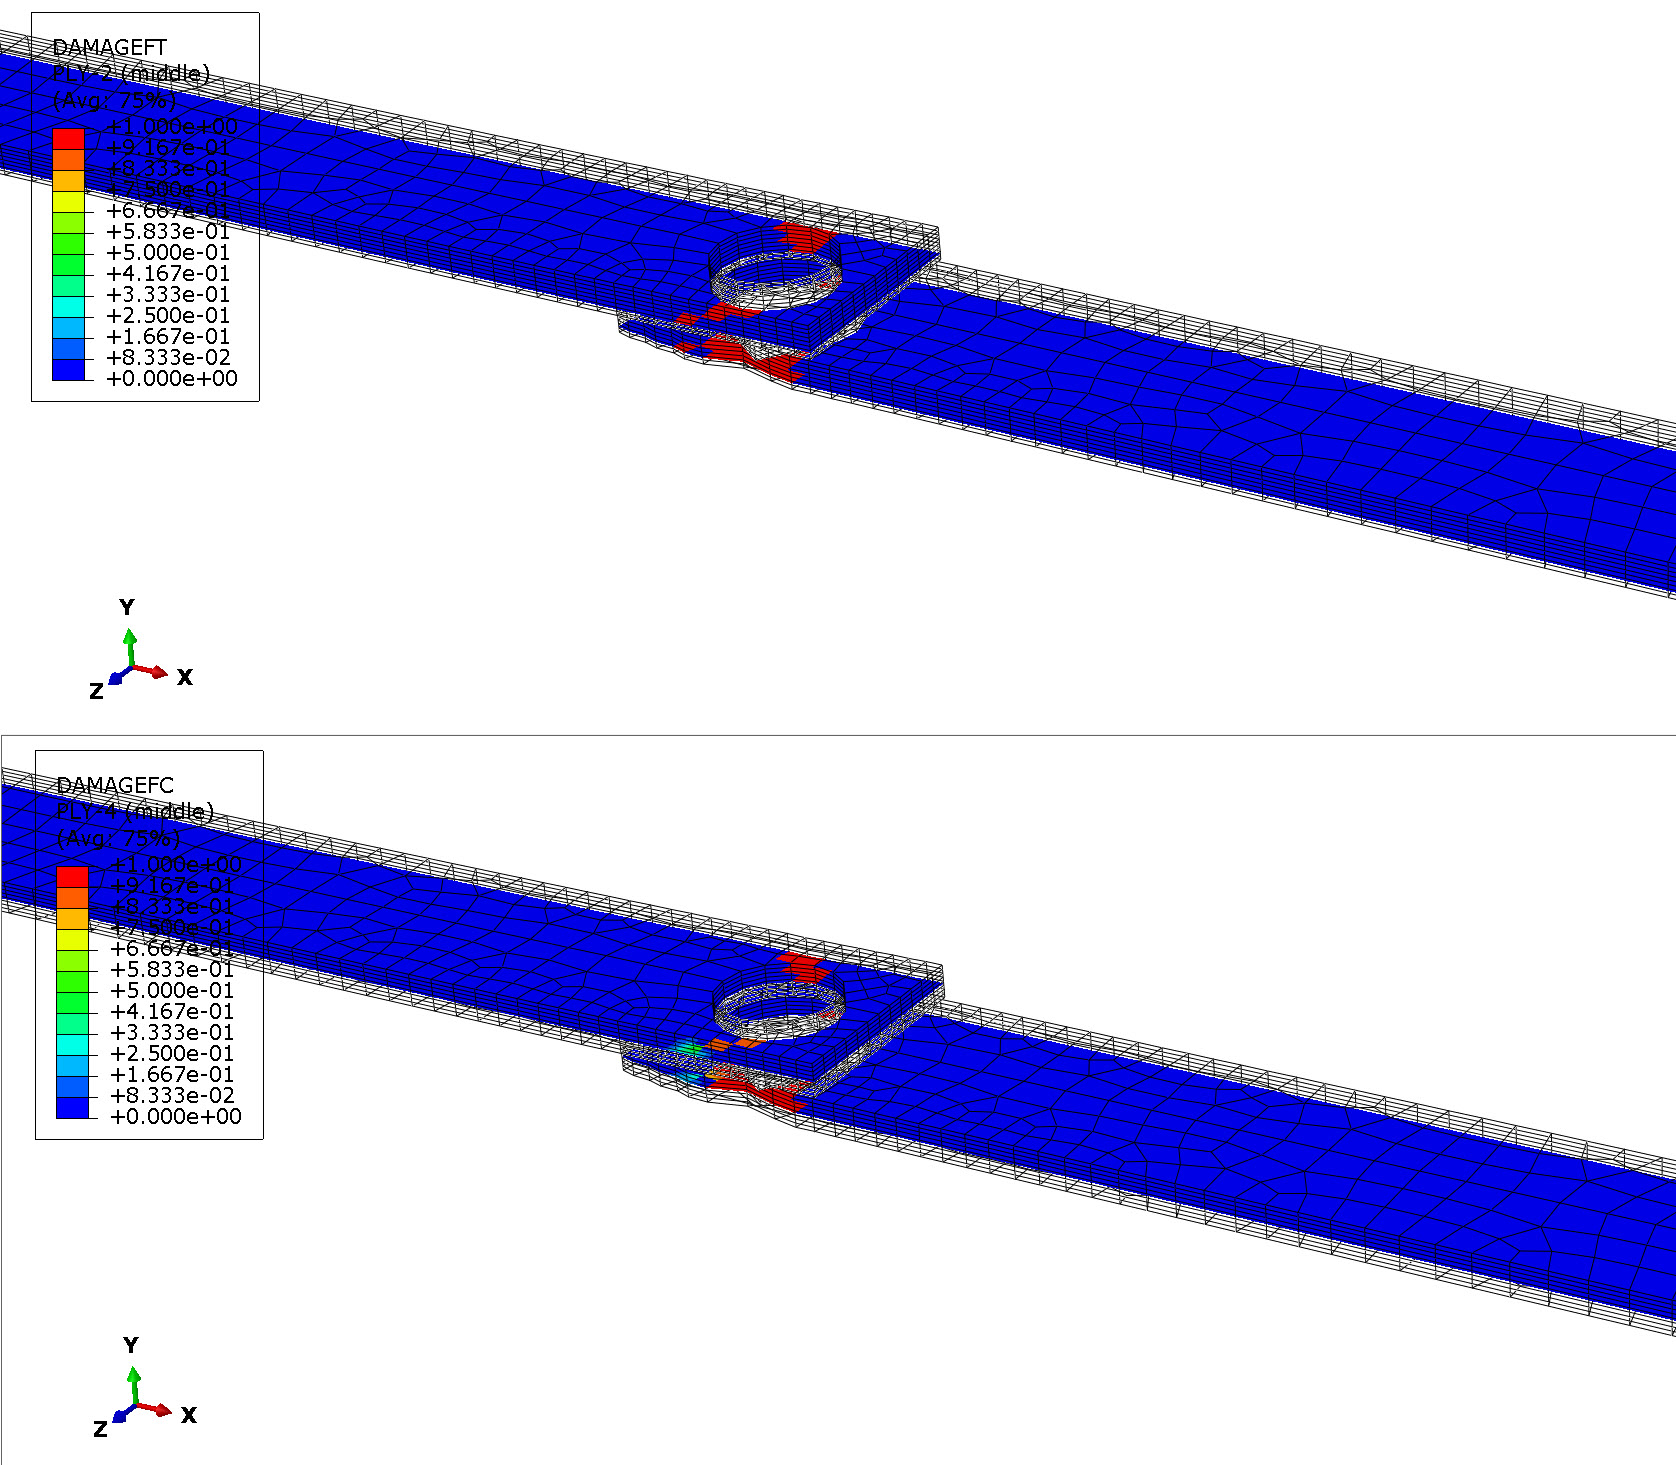
Figure 12 :Damage evolution for tensile (top-ply 2) and compressive (bottom-ply 4) fiber damage.
Exemplary per ply contour plots, for the matrix damage evolution are given in Figure 13 below. Those relate to matrix damage evolution, for tension and compression failure modes.
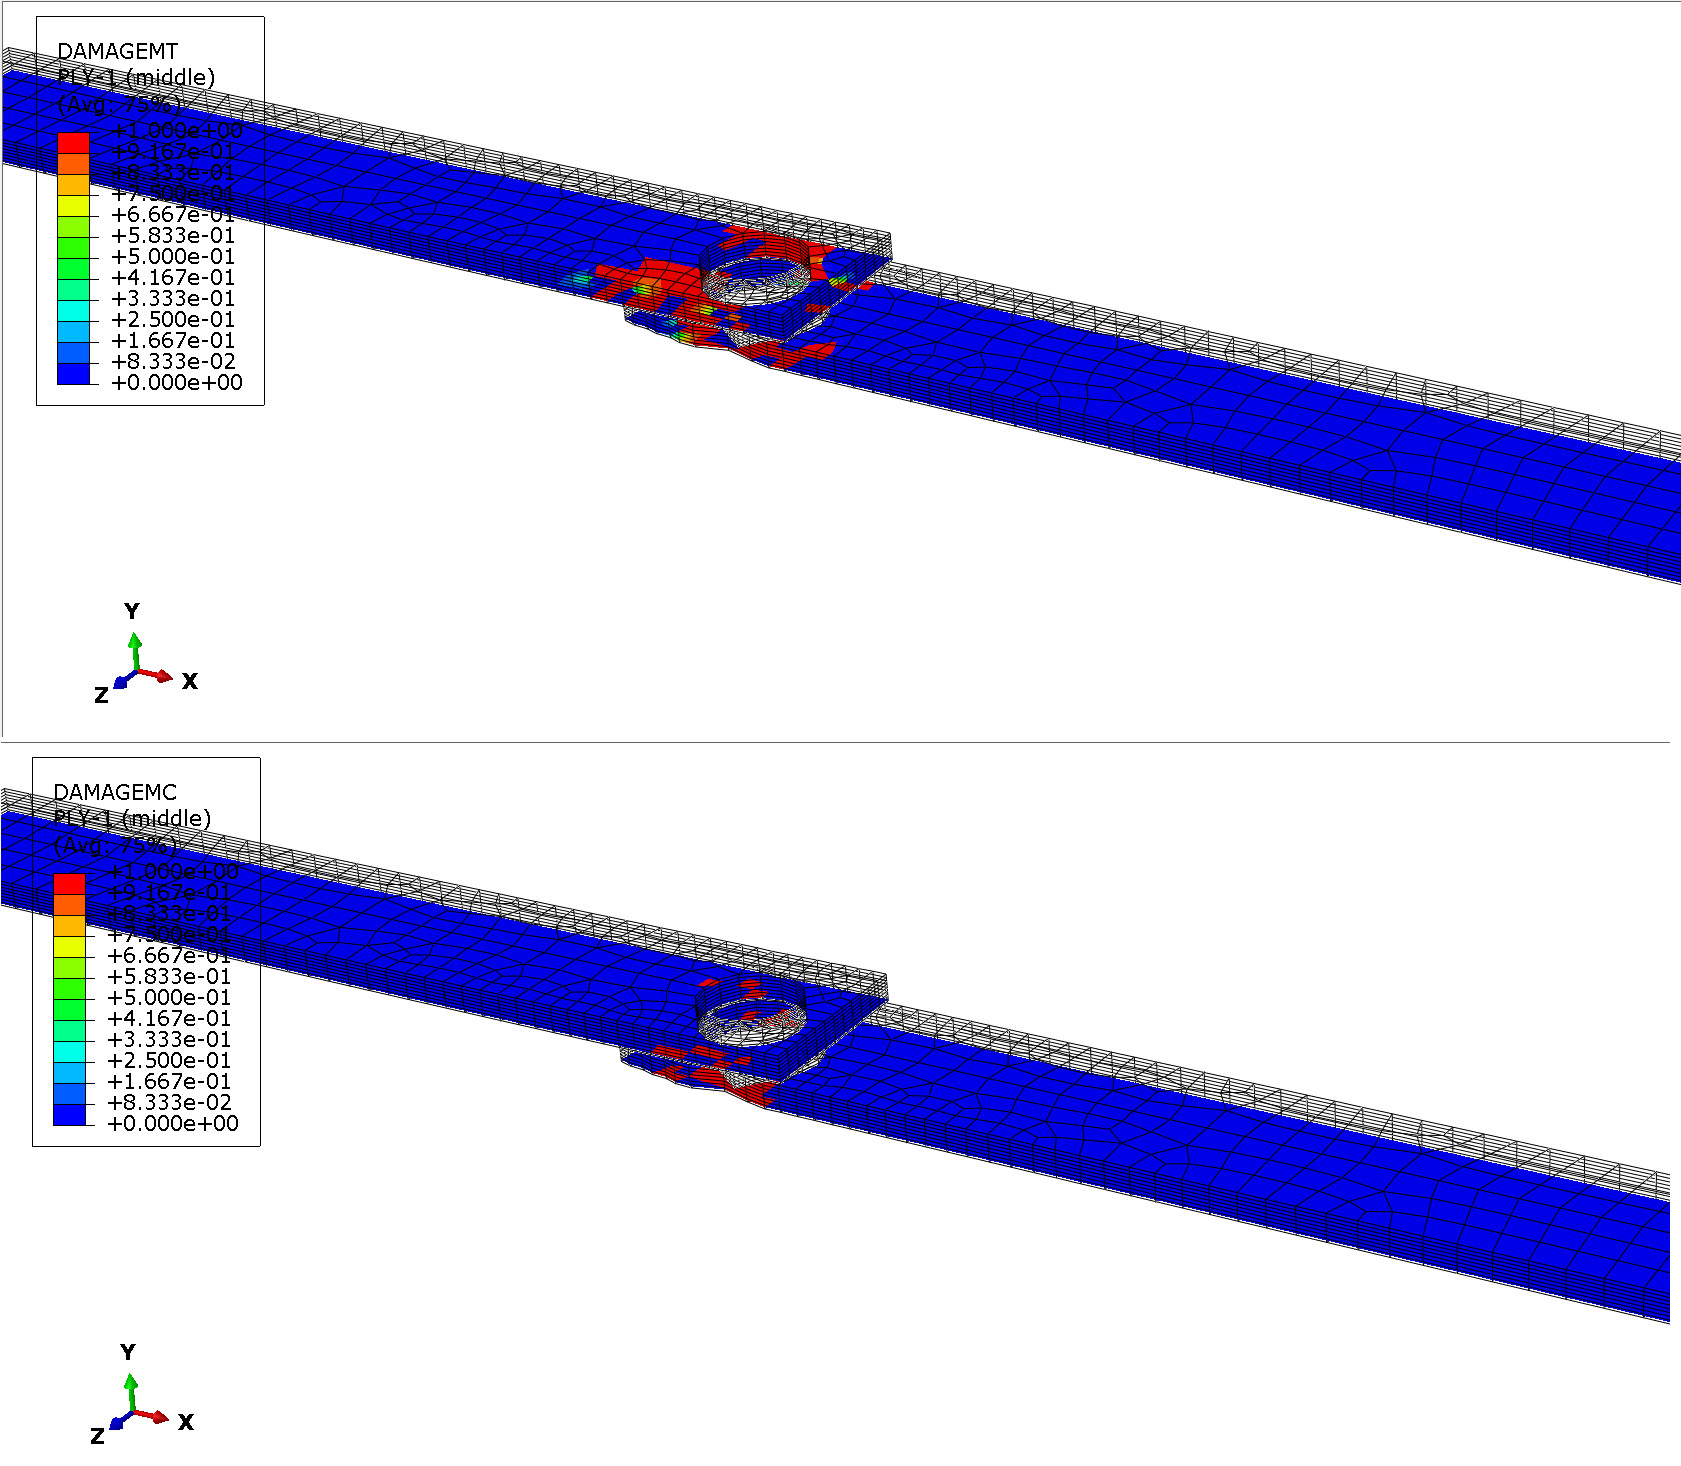
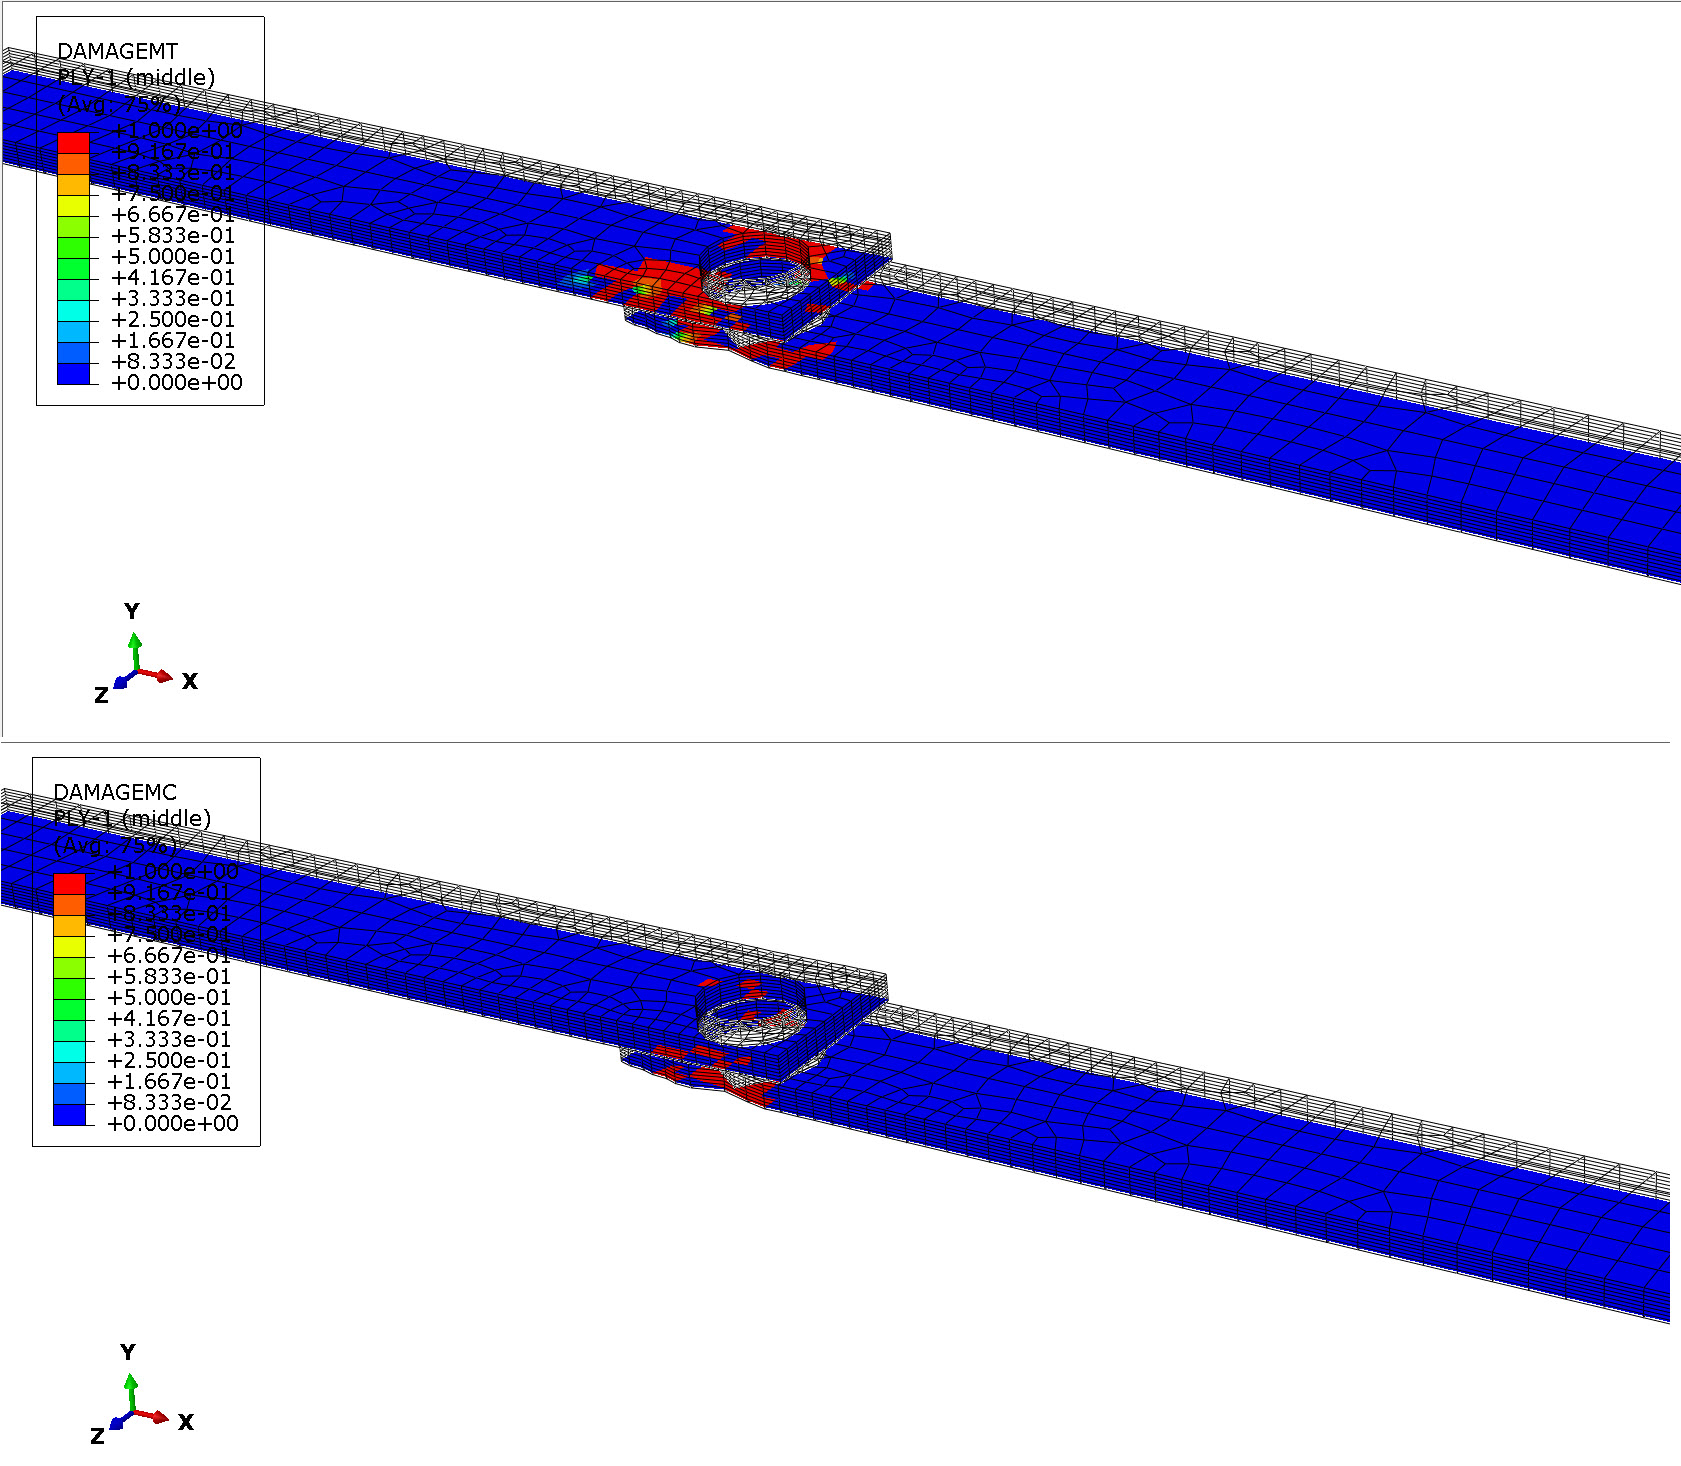
Figure 13 :Damage evolution for tensile (top-ply 1) and compressive (bottom-ply 1) matrix damage.
Force Related Results
Since we have applied our external load as displacement via an RP, coupled to the end face of the plate, we can assess the overall joint behavior and the effect of damage on the joint. Reaction force along the X direction against the imposed end displacement are plotted in Figure 14.
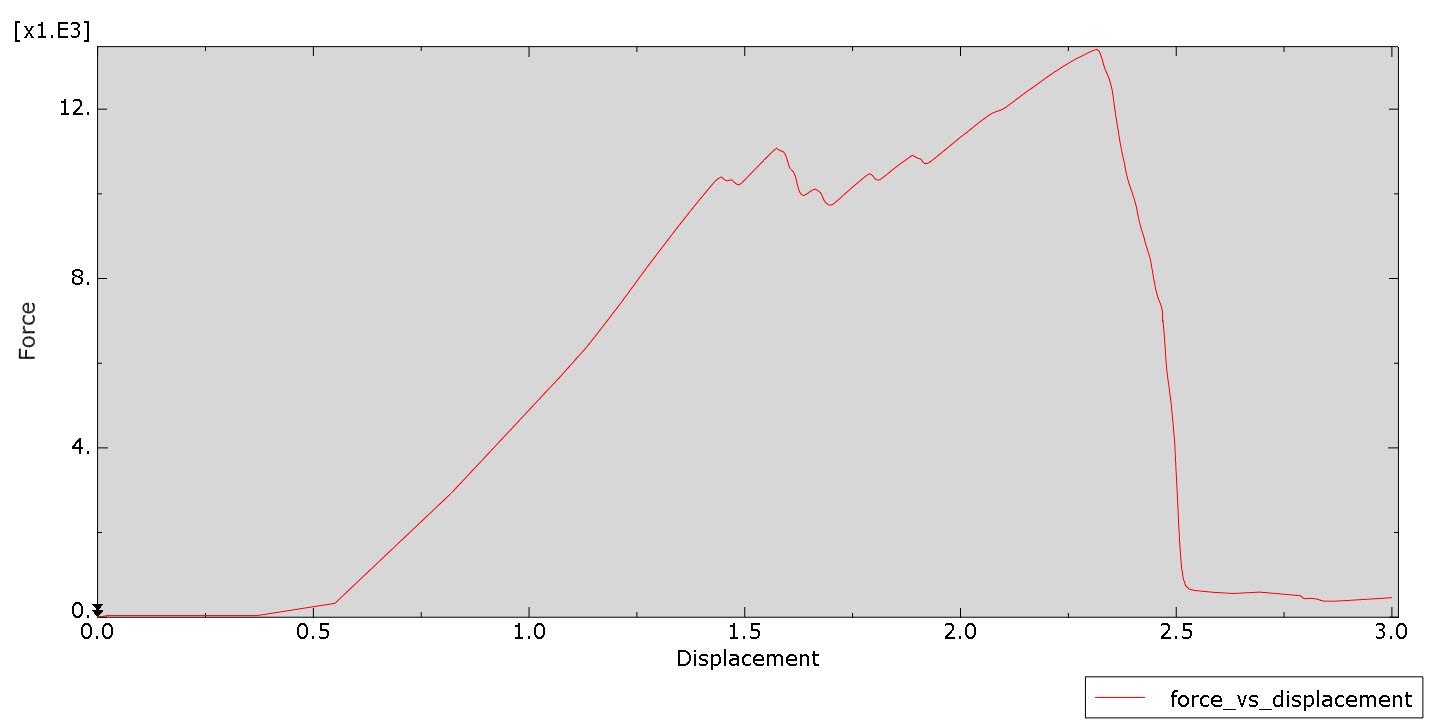
Figure 14 :Damage evolution for tensile (top-ply 1) and compressive (bottom-ply 1) matrix damage.
Figure 14 shows the overall behavior of the joint under the external displacement. The non monotonic behavior (1.5 to 2.4 mm displacement) relates to damage initiation and evolution along the various plies as well as the to the contact (with the bolt) being updated as the material degrades.
Towards the last increments of the displacement, the per ply failures and material degradation has collectively impacted the joint's bear loading behavior.
The user can also decide to activate element deletion (when the element stops contributing to stiffness,through the element type window and by requesting the STATUS field variable) if that serves the modelling intentions.
Additionally we can also request output relating to the bolt loads, to assess how these will change due to the external loading. The bolt loads through the analysis are plotted in figure 15 in Newtons.
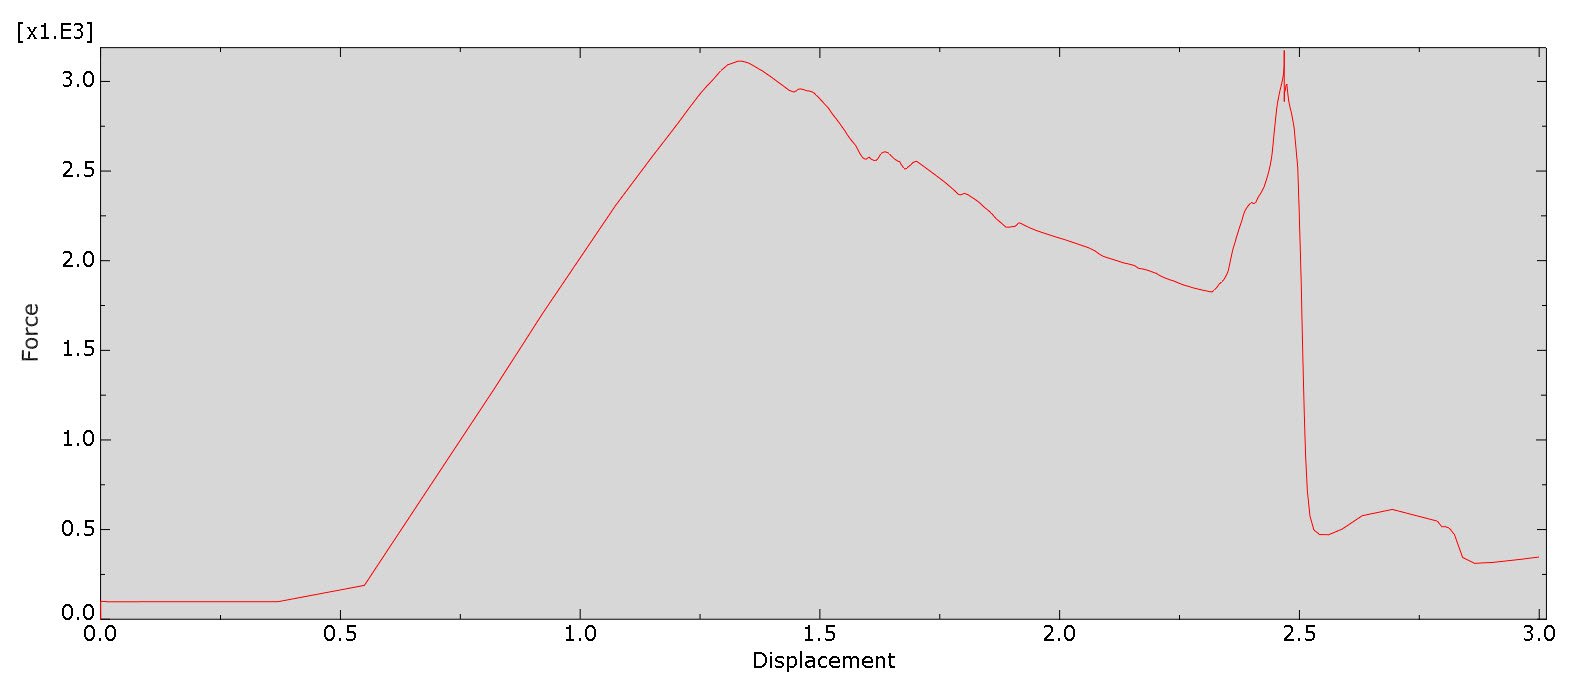
Figure 15 :Loads(Newtons) acting on the bolt against displacement (mm).
The above graph, can help assess the maximum loading allowed for a bolt as well as the effect of the pretension load with respect to clamping the plates (clamping should be as high as possible to avoid non axial loads on the bolt).
Results video
Here, a video from the results can be found.
Discussion
In this blog post, several modelling features of laminated composites were shown.
In these types of laminated composites, the individual ply failure modes and interlaminar shear stresses are critical, for the component's structural assessment. Additionally composites will still be able to bear a load after a certain damage mode has been initiated. Therefore the assessment of the remaining load bearing characteristics of composites is quite important. The modelling features shown here, can provide this type of assessment.
Additionally, since we are talking about a bolted connection, the bolt load levels as a consequence to the external loading or to even damage in the joint (as was shown), should be adequately captured. The bolt components are critical and improper bolt design for a given load will seriously jeopardize the structural health of a joint as it will most likely lead to bolt failure.
Additionally since contact was modelled, this type of fe model can provide insight, on the bolt properties (material, geometry) and clamping force levels for a given external loading scenario.
Limitations
- No mesh convergence study was performed
- No delamination failure was modelled (you can do this with the Cohesive Zone Model or with the Virtual Crack Closure technique)

