In this blog post, we will be looking into a different discretization method, available in Abaqus Explicit. This discretization method can prove to be really useful, in applications where gross distortions or large spatial displacements are expected to occur. A category of applications that can benefit from such a technology, are installations/decommissions of deep sea components, interacting with the seabed.
Discretization Technologies Available in Abaqus Explicit
In terms of the discretization technologies, available in Abaqus Explicit, those are shown in Figure 1.
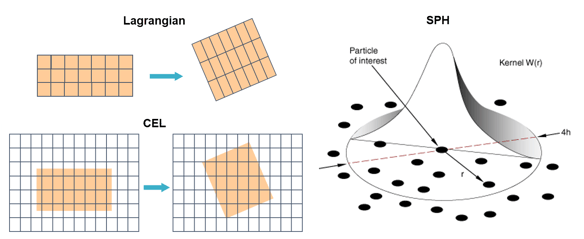
Figure 1: Lagrangian, CEL and SPH technologies available in Abaqus Explicit.
This continuum formulation, is the most familiar one, to the majority of fea engineers. With this formulation, mesh and material points, are deforming as one entity in space, i.e. mesh is fixed to the material.
This formulation, offers an alternative continuum discretization method, to the Lagrangian. The Eulerian part of the formulation , uses compressible Navier Stokes equations. In this formulation, the (Eulerian) mesh stays fixed in space, and material is allowed to flow freely through the elements. The material boundary is represented by volume fractions within each element. Contact interactions with Lagrangian parts, are handled through general contact.
This formulation, uses a collection of nodes, to represent a body. The mechanical response of the body, abides to the assigned material properties. Contact interactions with Lagrangian parts, are handled through general contact. The Smooth Particle Hydrodynamics formulation, will be used, in the blog's example, the installation/decommissioning of an anchor.
Finally, one more formulation ,well suited for particle mixing applications, is available in Explicit. In the Discrete Element Method (DEM), each particle is a single element (node). This method is not intended for modelling the deformations of the continuum.
Application and Technology
Mooring products for offshore applications, such as anchors, are exposed to harsh environments. Therefore their proper design, is critical, particularly for the decommissioning phase (pull out), as there are failure risks involved then (i.e. buckling, exceedance of allowed strain etc.). Figure 2, shows the modelling domain in Abaqus.
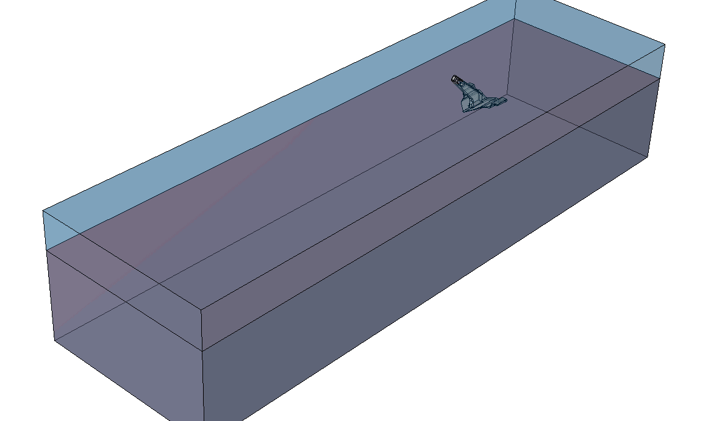
Figure 2: Anchor geometry and SPH domain(dark color).
In light blue color, the box geometry is shown. This instance will be meshed as a Lagrangian rigid, and will only serve the purpose of containing the seabed soil, that will be modelled with SPH elements. The soil block(dark color) dimensions used, were 40(l)x12(w)x8.5(d) m. The anchor geometry is also shown. This will be modelled as a Lagrangian rigid as well(with a rigid body constraint).
The Lagrangian formulation (for deformable bodies), typically contains the largest variety of modeling features, material models etc.
However, for applications such as this example, SPH is more practical, in terms of implementation and handling of extreme deformations. Additionally, most material models in Abaqus, are available to use with SPH!
A detail of the element conversion setting for SPH, is shown below, in Figure 3.
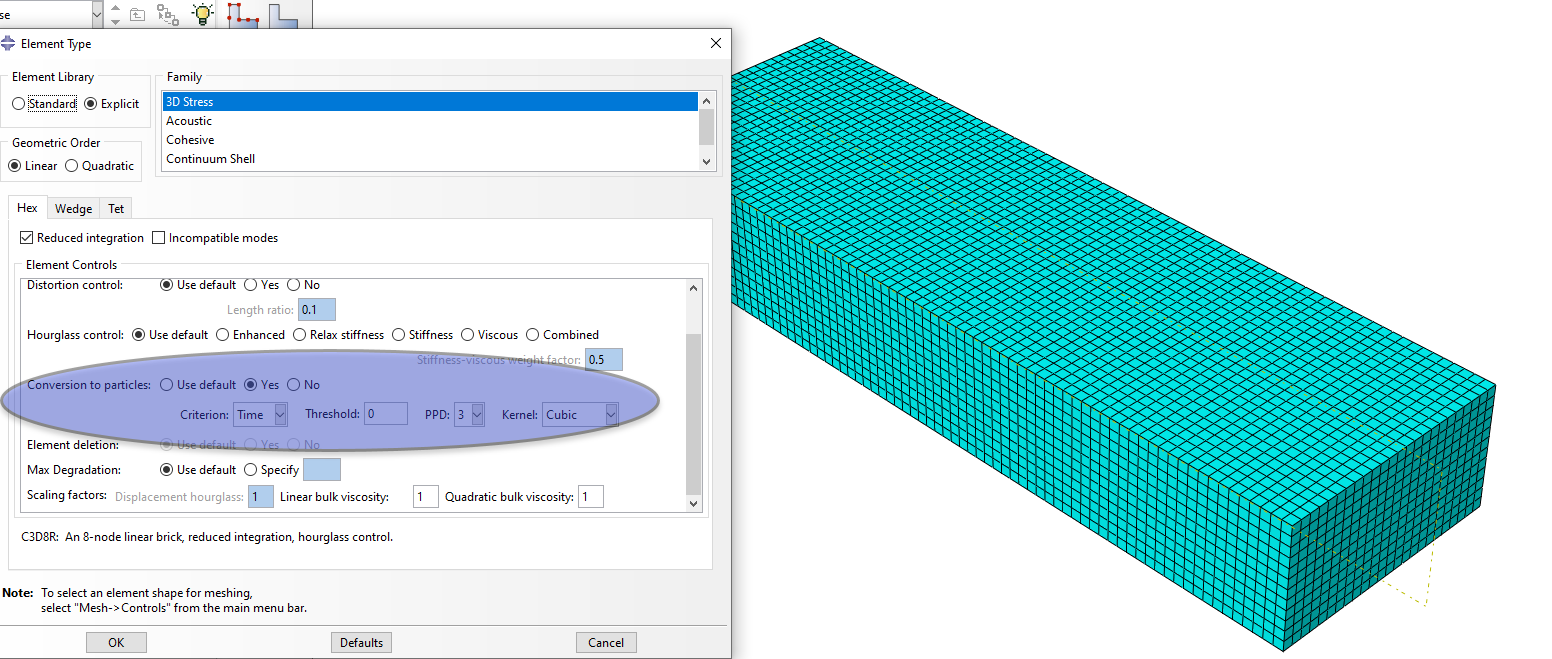
Figure 3: Conversion of Lagrangian mesh to SPH on soil block.
Still, there are remeshing techniques available, implementing a Lagrangian description, (you can read Christine's blog about those, here). For the blog's example, a mesh to mesh solution would be the most appropriate. Still its implementation and success, would really be dependent on the user's experience level.
This 3 step Explicit analysis, comprised of an installation phase (10 sec), a rotating phase (3 sec), and a pull out phase. Gross distortions(soil) and large spatial displacements (anchor) were expected to occur.
Material Modelling
The complexity in the material modelling, for this application, was specific, to the seabed soil, that was the only deformable body in the analysis. The designated soil type, was stiff clay, with the following material properties, shown in Table 1. Soil plasticity was implemented, in the form of the Mohr Coulomb model.
Table 1: stiff clay material properties Mohr Coulomb.
| |
Value |
Comment |
| Density |
1190 kg/m3 |
based on submerged unit density, for stiff clay |
| Young's modulus E |
50 MPa |
(can go up to 100 for stiff clay) |
| Poisson's ratio ν |
0.35 |
saturated clay (can go up to 0.5) |
| friction angle |
0 |
stiff clay |
| dilation angle |
0 |
stiff clay |
| Cohesion yield stress (M-C) |
0.2 MPa |
for absolute plastic strain = 0 |
The sph discretization was used for the soil, with the linear bulk viscosity increased (0.6) since solid material was modelled . SPH formulation is quite appealing, as most built in material models for geotechnical materials, can be used.
Soil Structure Interaction
For the contact between soil and anchor and for self contact on soil, a global coefficient of friction(μ=0.3) was used, with the general contact algorithm. For the interaction between block and box (containing the stiff clay), the same property was used. It should be noted, that ensuring there would be no effect in the results due to the domain size, was out of scope, for this demonstration.
Lastly we excluded contact between the anchor and the box, as expected. A detail from the general contact interaction definition is shown in Figure 4, showing the excluded surface pair option.
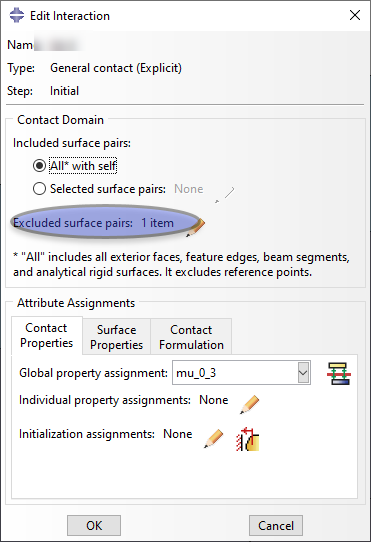
Figure 4: General contact definition for Anchor analysis SPH.
Loads and Boundary Conditions
The kinematics for all three steps, were implemented with the application of non zero velocity (linear, rotational), on two Reference Points. For the installation and rotating phase, a linear and a rotational velocity were applied on the center of mass of the anchor, respectively. For the pull out phase, linear velocities (x and y) were applied on a pulling reference point, that was properly connected to the anchor, at the same location as for the real life structure. Certain degrees of freedom were released, in order to mimic the actual chain link-anchor connection (allowing for rotation).
The reference points under discussion, are shown in Figure 5. A predefined Y velocity was applied in the center of mass of the anchor, and the anchor was placed at a small clearance to the seabed top, to save on computational time. Gravity was active for the anchor and the soil instances.
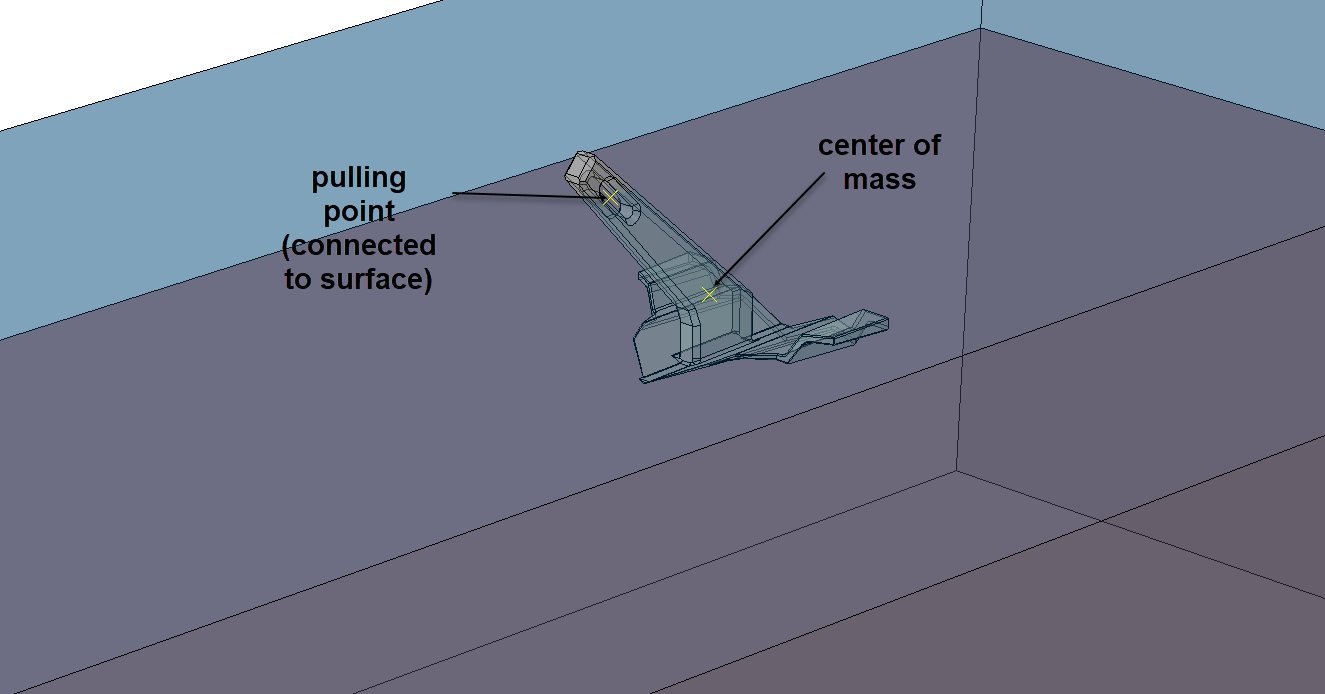
Figure 5: Reference points for application of anchor motion.
Through implementing non zero boundary conditions for the kinematics, output of reaction forces/moments, was readily available in Visualization. This type of output, is quite useful, for assessing the anchor design.
Of course, different input (i.e. forces, displacements) could have been used, for setting up the kinematics in this analysis, based on the available information.
Results
Figures 6 and 7, show the von Mises stresses and max principal stresses in the soil, respectively, at the end of the anchor pull out.
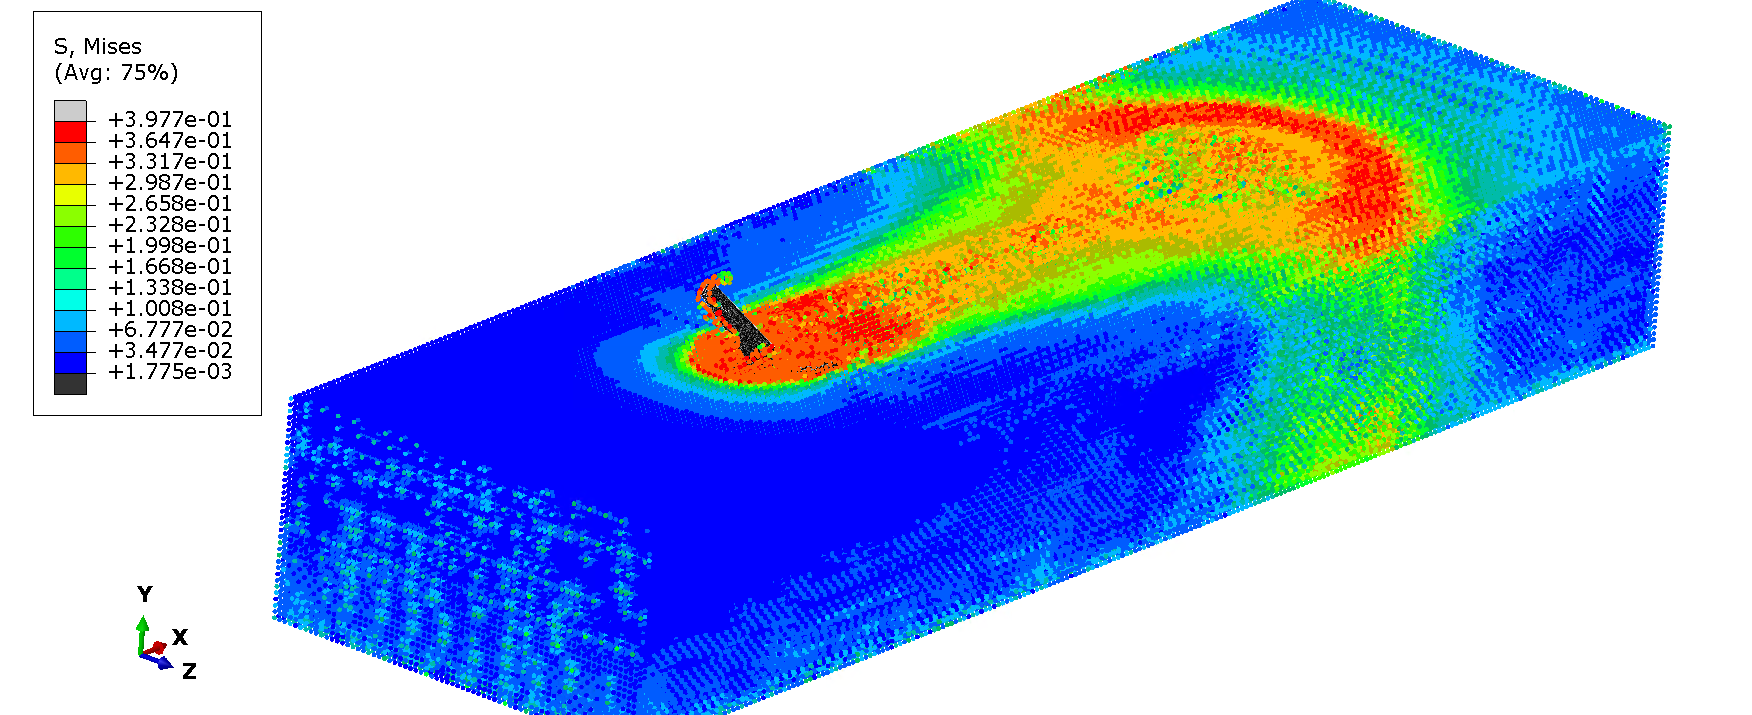
Figure 6 von Mises stresses (MPa) in soil SPH.
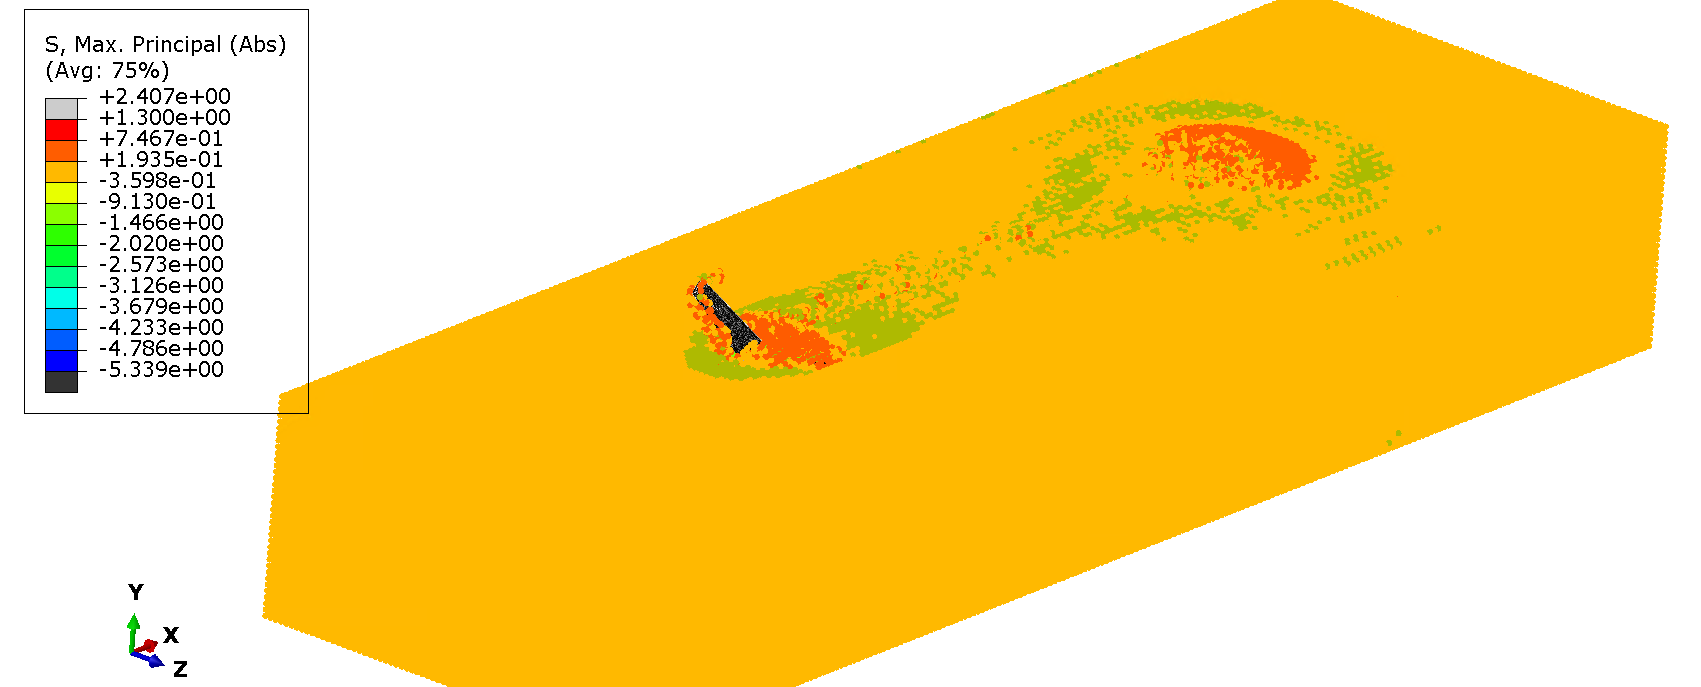
Figure 7 max principal stresses(MPa) in soil SPH.
Figures 8 and 9, show the equivalent plastic strain magnitude and max principal strains in the soil, respectively, at the end of the anchor pull out.. The views in these figures, are view cuts, half way through the soil domain (z direction).
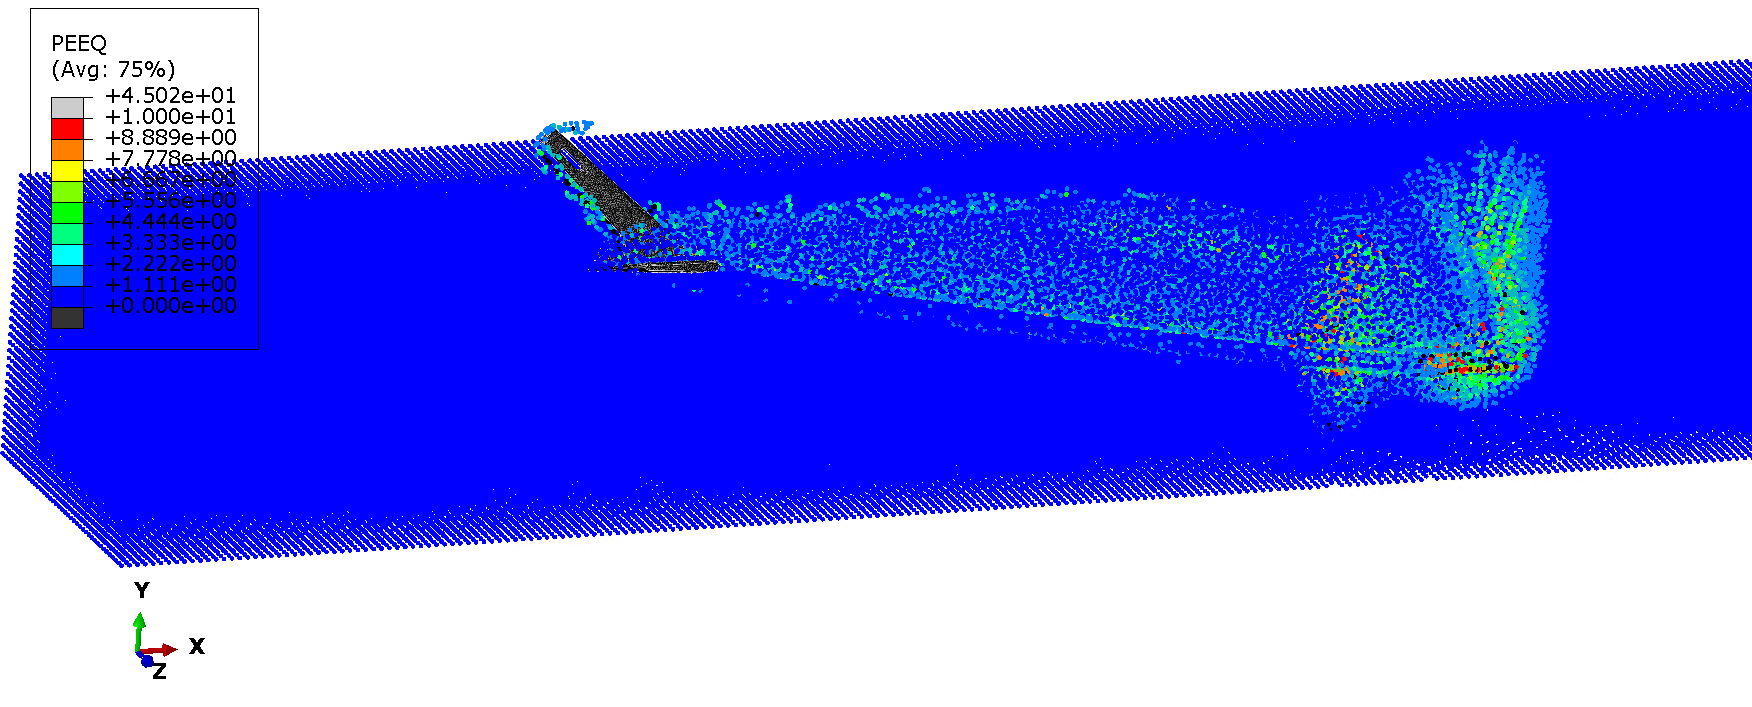
Figure 8: equivalent plastic strain magnitude in soil SPH (view cut).
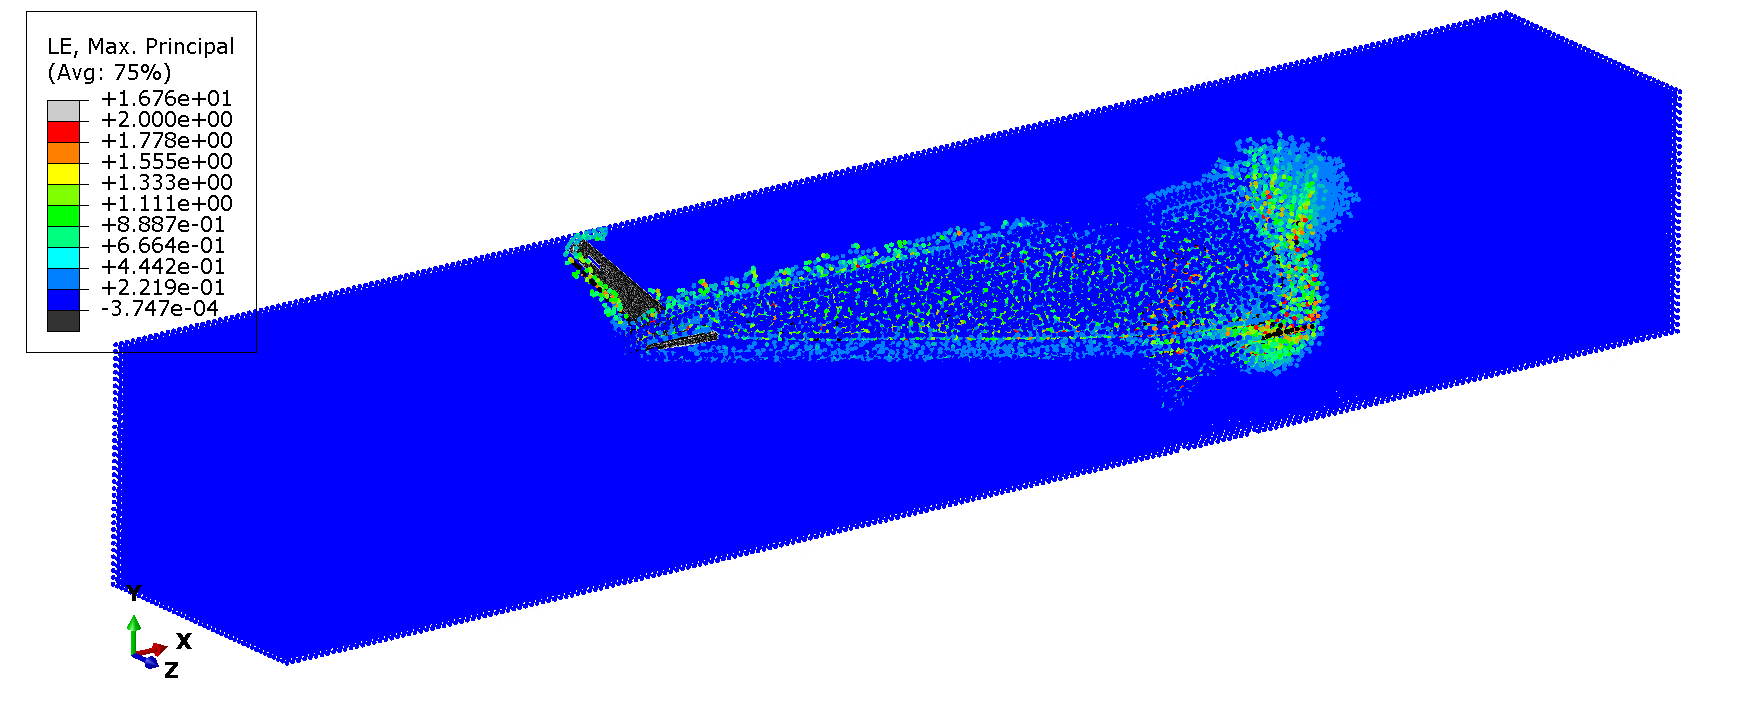
Figure 9: max principal strain in soil SPH (view cut).
Figures 10 and 11, show output, at the anchor locations, on which the motion was prescribed. This output is really important for anchor design, particularly for the more critical decommissioning (pull out) phase of the component.
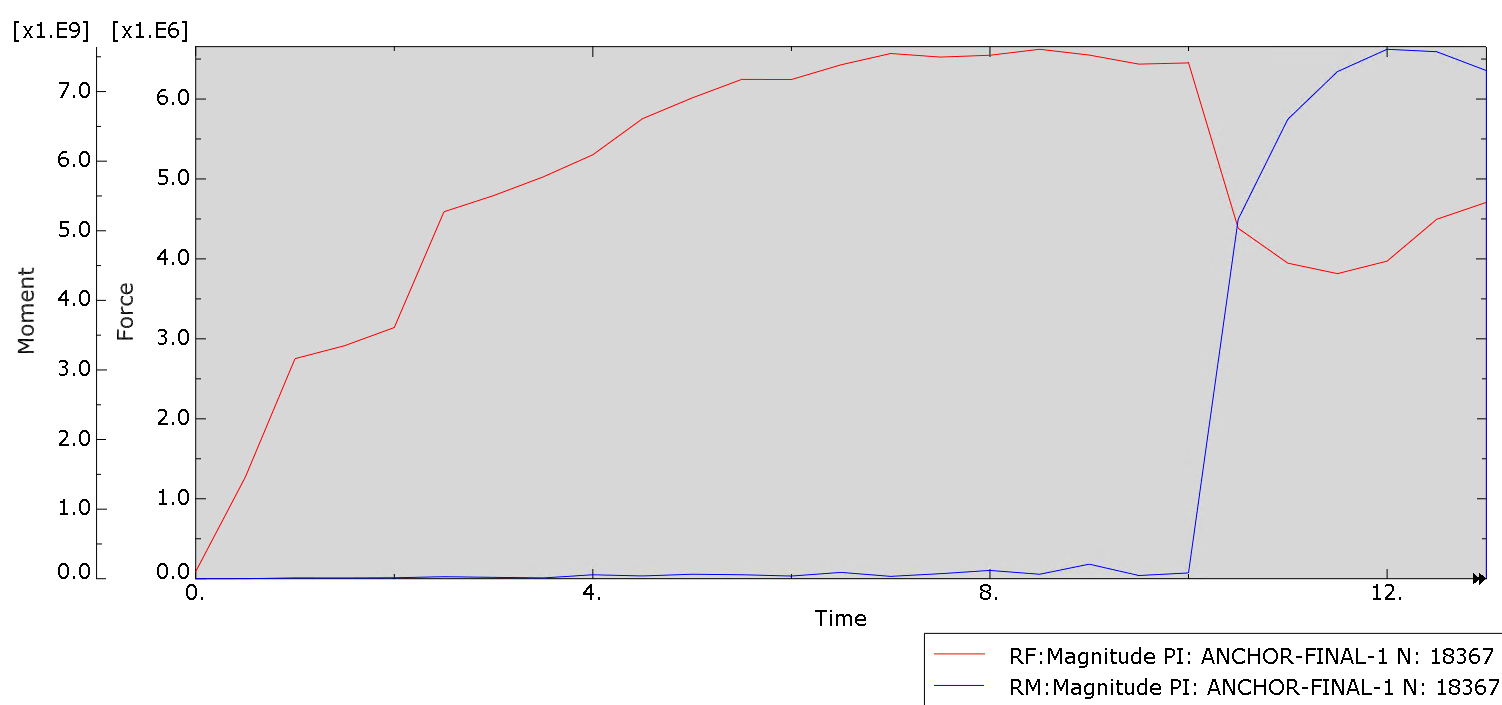
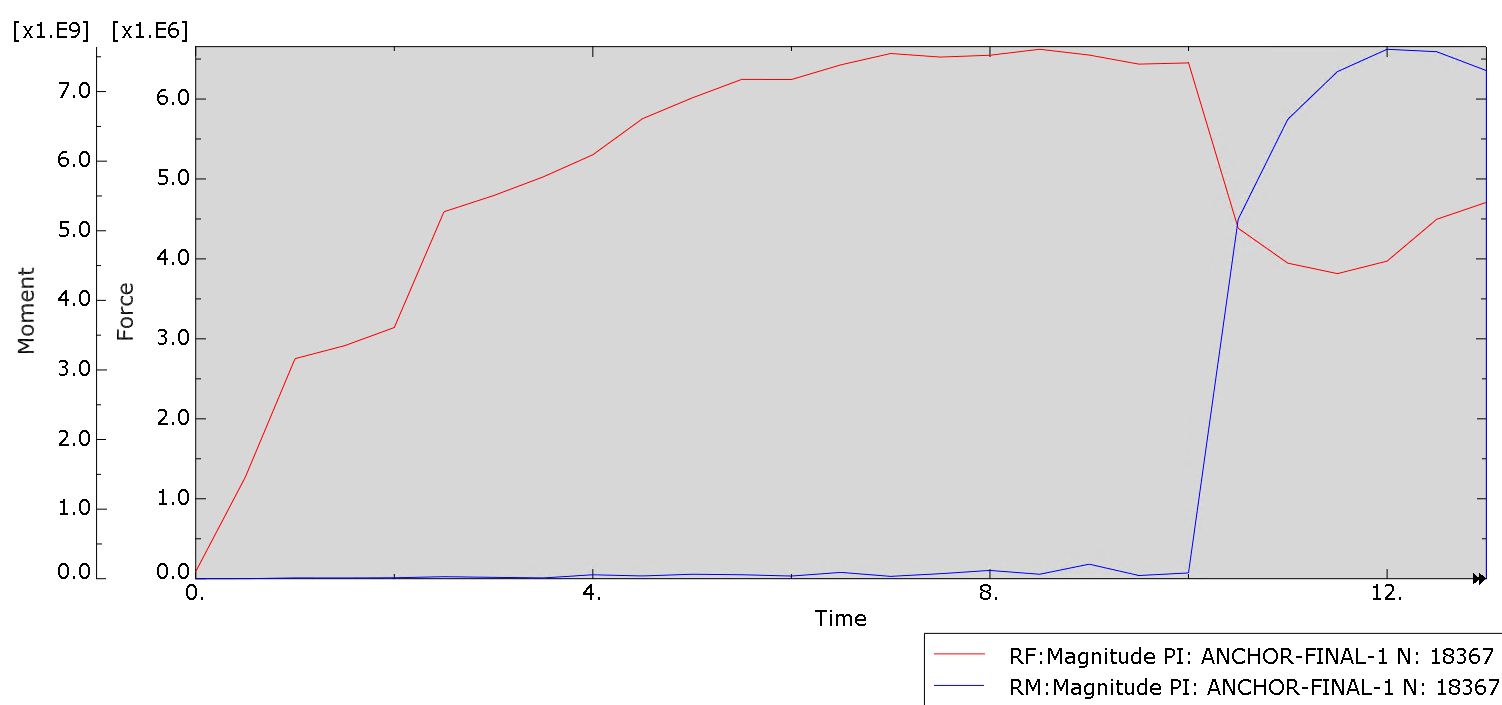
Figure 10: Forces (N) and Moments (Nmm) at the anchor's center of gravity, for installation and rotating step.
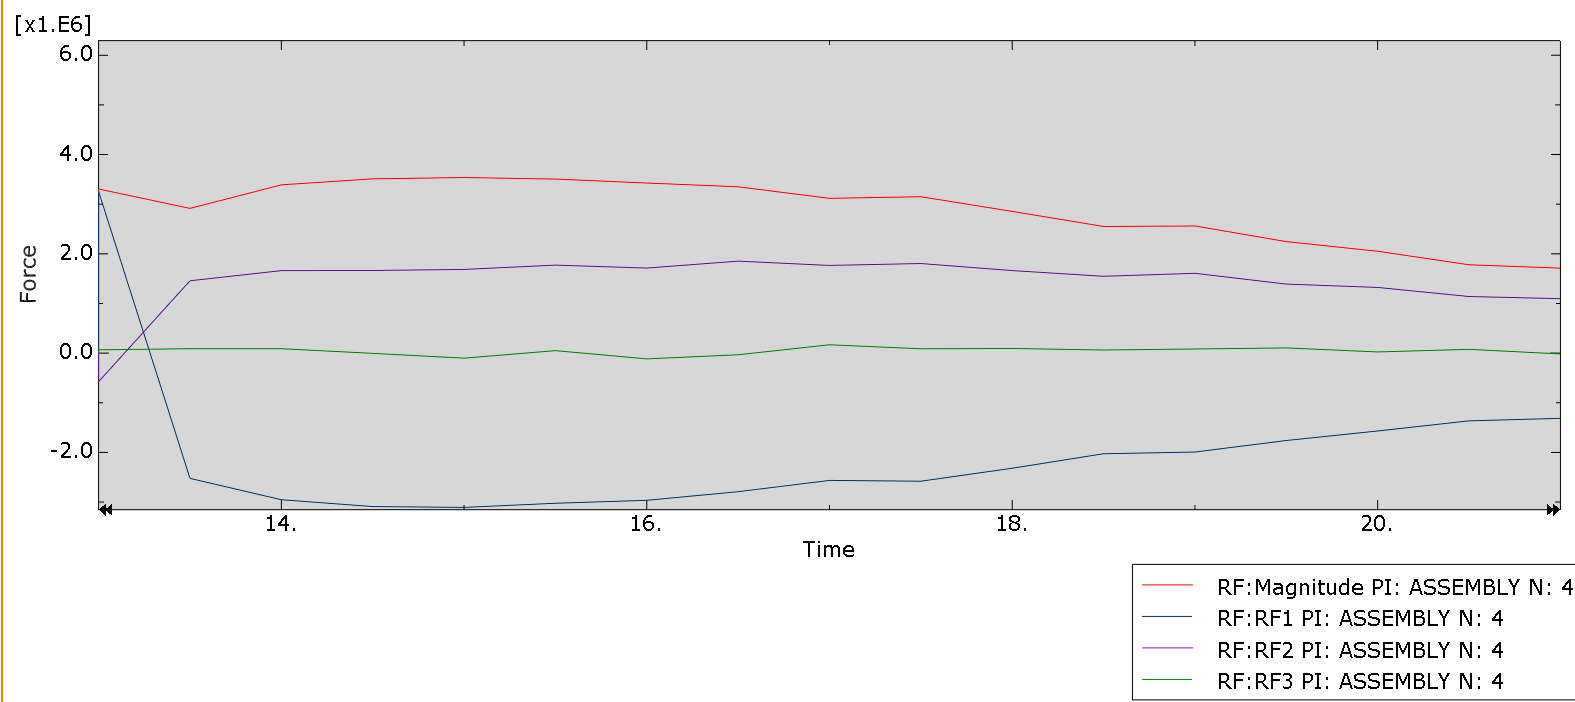
Figure 11: Forces and force magnitude (N) at the anchor's pulling point, for the pull out step.
With this type of analysis and output, different designs of anchors and soil types for the seabed, can be explored.
This is quite useful, as eventually these studies can help optimize such deep sea components and/or deployment processes.
Below, result videos are shown from the anchor simulation. The first video, shows a general 3d view of the von Mises stresses (MPa) during the simulation.
The second and third video, show cut views (z-direction half way) of von Mises stress (MPa) and equivalent plastic strain magnitude.

