
Posted by Nikolaos Mavrodontis
Table of contents
In this blog post, we will be showcasing the Abaqus Report Generator plugin (RGP), that is by default included in the Abaqus product installation. The RGP allows the user to create an HTML report using model and results data. The capabilities and functionality of this plugin will be demonstrated with an exemplary results database.
Introduction
The RGP allows the user to generate an HTML report, including model information and results, extracted from an Abaqus output database(*.odb).It offers customization options, allowing the user choose the information to be included in a report, and to also customize the appearance of the report.
The RGP can be launched from the main menu bar of the Visualization module, by going to Plug-ins>Tools>Report Generator. Once the content and settings for the report output, have been selected by the user, then by clicking the Generate button, Abaqus will generate the respective html report and automatically open it in the default browser used. More information on the plugin can be found here.
Exemplary Results Database
The exemplary results database that will be used to demonstrate the RGP capabilities, is a fully coupled thermal stress analysis of a bicycle disc brake during braking. Von Mises stress results and Nodal temperature results in MPa and degrees Celsius respectively, are shown in Figure 1 .
.png?width=1696&name=Figure1(vM%20stress%20and%20Nodal%20temp).png)
Figure 1: Von Mises results in MPa (left) and Nodal temperatures (right).
RGP Graphical Data Options
RGP allows the user to control the type of graphical data output that they would like to include in the report. The following figure types are supported:
3D XML Figures
Toggle on Include 3DXML to include a figure in 3D XML format, a file format that enables you to manipulate a three-dimensional rendition of your assembly directly in the report. If your report includes content in 3D XML format, you must use Internet Explorer 11 ( standard on Windows 10) and the 3D XML Player to display the report properly. You can download the 3D XML Player from http://www.3ds.com.
-2.png?width=666&name=Figure2(3Dxml)-2.png)
Figure 2: 3dxml option.
2D custom views
The user can toggle on one or more of the View options settings, to generate figures of the assembly based on either predefined or user defined views in the CAE..png?width=807&name=Figure3(2Dcustomviews).png)
Figure 3: 2D custom views.
Additional Figures
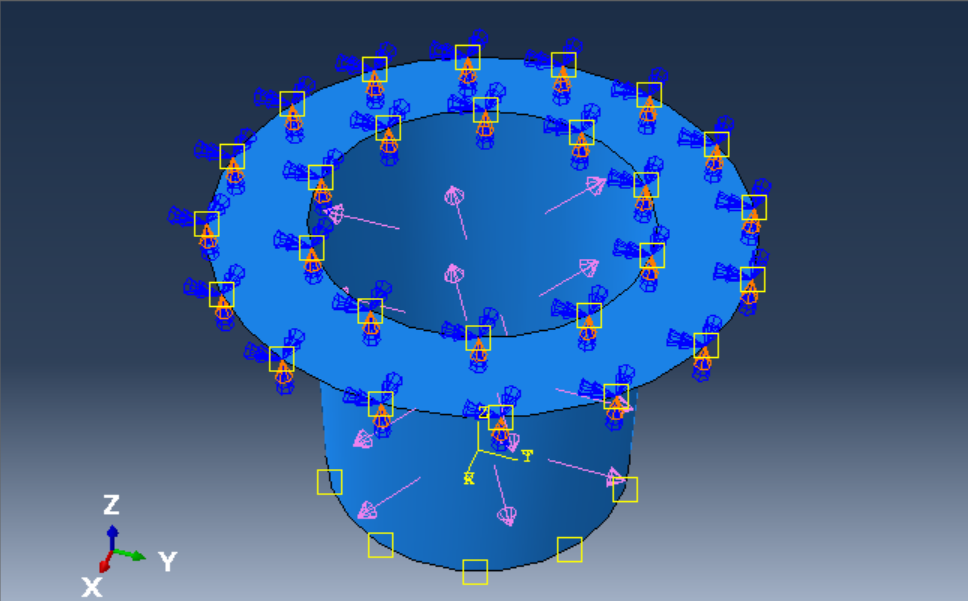
The user can additionally use the Save Current Viewport plugin (SCVP), to create custom figures that can then be included in a report. Those custom figures will be available in the Additional figure lists in the RGP. Each figure list will only contain the custom figures that were created in the corresponding module. The SCVP (Plug-ins>Tools>Save Current Viewport) is available in the Property module, the Assembly module, the Load module, the Interaction module, and the Visualization module.Figure 4, shows an example of using the SCVP (step “1” in figure) to save an assembly figure (with material color code) and then include it in the report generated by RGP (step “2” in figure). Notice that the saved figure from the SCVP, is only available in the respective (instance) tab of the RGP.
.png?width=1554&name=Figure4(Assembly%20figure-report).png)
Figure 4: Assembly custom view generated with SCVP.
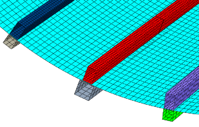
A similar example for von Mises stress is shown in Figure 5.
-2.png?width=1729&name=Figure5(results%20figure-report)-2.png)
Figure 5: Von Mises Results(MPa) custom (cut) view generated with SCVP.
Report Generator Options
The options in the RGP are organized into tabbed pages corresponding to different sections of the HTML report. The following options are available:
General
The output directory where the html report will be generated, can be chosen. The user can assign a custom report title, that will appear on top and also define a user name for the report generation. The image style (inline vs thumbnails) can also be defined.
Additional options allow the user to include or exclude top level components of the report, and select specific contents to be include per report section.
The general tab of the RGP side by side with the generated report based on the input is shown in Figure 6.
-2.png?width=1394&name=Figure6(general%20tab)-2.png)
Figure 6: General tab settings and respective output (left).
Materials
The user can include figures and a 3dxml file that displays the assembly with a material color code (figures generated with the SCVP are supported). The user can also append a table of materials to the material figures in the report. By default, the table of materials describes the material properties for the materials defined in the assembly and provides a color key to indicate which materials correspond to each color in the figures. This is shown in Figure 7.
-2.png?width=1207&name=Figure7(materials%20tab)-2.png)
Figure 7: Materials tab settings and respective output (left).
Instances
The user can include figures and a 3dxml file that display the assembly with its contents color coded to highlight the part instances(figures generated with the SCVP are supported). The user can select the part instances that they want to display from a list and display the part instances together in a single image or individually in separate images.
-4.png?width=1352&name=Figure8(instance%20tab)-4.png)
Figure 8: Instances tab settings and respective output (left).
Loads
If any figures where saved from the user in the load module, while using the SCVP, those figures will appear in the Load information section of the generated report.
Interactions
If any figures where saved from the user in the Interactions module, while using the SCVP, those figures will appear in the Interaction information section of the generated report.
Results
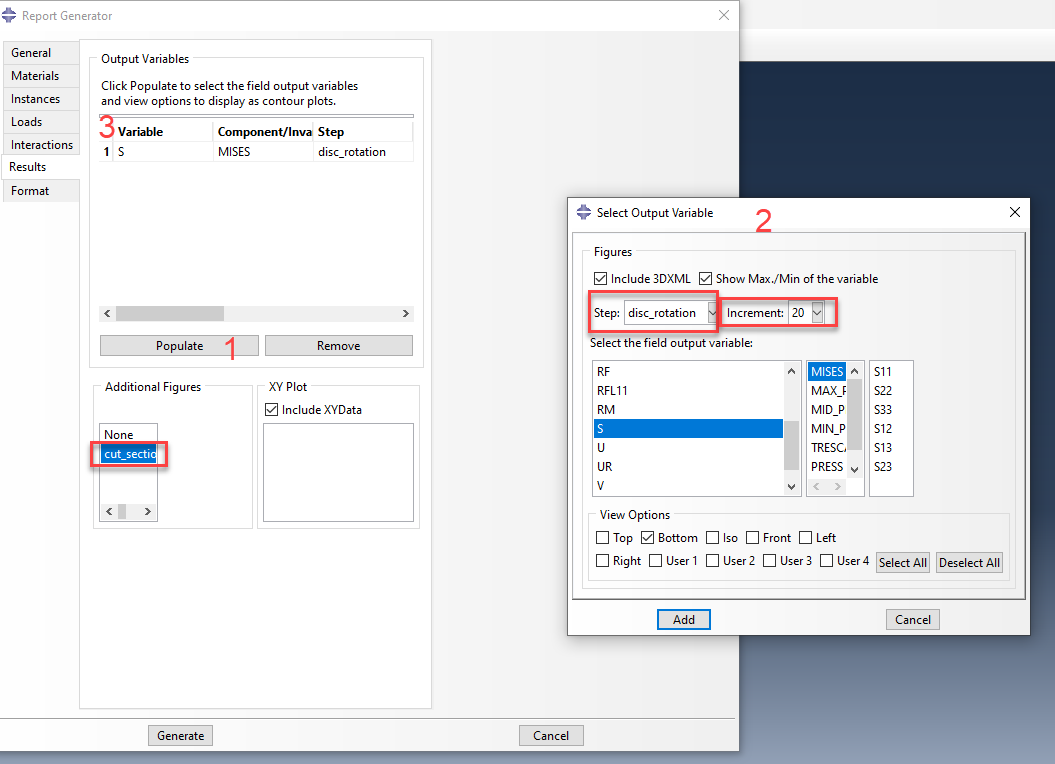
The user can include figures and a 3dxml file, that displays contour plots of the assembly from a single step and increment in the analysis for the selected field output variables (figures generated with the SCVP are supported).X-Y plots from the current output database can also be included in the report.
Figures 9 and 10, showcase the results tab settings and generated output.
.png?width=1055&name=Figure9(results%20tab).png)
Figure 9: Results tab settings 1.
-2.png?width=1452&name=Figure10(results%20tab-2)-2.png)
Figure 10: Results tab settings 2 and respective output (left).
Format
The user can customize the appearance of the report by generating the report using a custom style sheet and by displaying an image such as a company logo in the report. Figure 11 shows an example of this.
-3.png?width=1452&name=Figure11(format%20tab)-3.png)
Figure 11: Format tab settings and respective output (left).
A video, showing the whole report generation process, is shown below.


TECHNIA Simulation provides top tier FEA, Non-linear, and Advanced Simulation Software, Training, and Consultancy. Our dedicated team of more than 65 Simulation experts across 16 countries advise and support your innovation with a wealth of specialist knowledge and experience.
About TECHNIA- Related news and articles straight to your inbox
- Hints, tips & how-tos
- Thought leadership articles
Helping you find the information you’re looking for. Discover webinars, events, FAQ's, case studies and tutorials.
VIEW HUB