

Posted by Paul Bolcos
Categories
Accuracy FEA model | femoral | Tips, Tricks & Approaches | tibial cartilage | collagen network damage | kneeTable of contents
In this blog I wanted to explore the age-old question facing most FEA analysts: Is my model good enough? with examples from my PhD work in knee joint biomechanics.
To create an FE model and run it in a reasonable amount of time, several assumptions and simplifications are needed. One of the aims of one of the knee joint FE models I developed previously was to rapidly identify locations at risk of OA in a patient-specific manner. To achieve the rapid part we used simplified materials models for the main tissues in the knee joint, based on previous literature studies:
- Bones are considered rigid, even though bone is anisotropic and has two main regions: cortical bone (dense and compact) and trabecular bone (also called spongy bone) (example).
- Ligaments can be modeled as bi-linear springs, even though ligaments are an incompressible fiber-reinforced material with fluid flow (poroelasticity) and viscoelasticity (example).
- Menisci are modeled as transversely isotropic materials. Menisci are in theory a fiber-reinforced material with fluid flow (poroelasticity) (example).
- Articular cartilage is modeled as a transversely isotropic material. Cartilage is more accurately represented as a fiber-reinforced material with fluid flow (poroelasticity), viscoelasticity with osmotic swelling properties (example).
Even though these are simplifications on essentially natural composites, they are enough to characterize the process I was trying to model: walking cycle. For instance, viscoelasticity doesn’t play too much of a role in fast processes. In this case, the focus was on the articular cartilage with a Young’s modulus ~10 MPa, while the Young’s modulus of bone is ~17 GPa (bones can be indeed considered rigid). For more details on the assumptions and simplifications in this applications see here and here.
These FE models were then used to identify patients at risk of OA, by assessing tensile stresses in cartilage. If values exceed 7 MPa, the area is susceptible to collagen network damage. This is still a hard limit and in the real world would vary according on the age and physical activity of the patient. Below is an animation of the results (Figure 1).
Figure 1: (Left) Tensile stresses during walking on the femoral and tibial cartilage (Right) Close up view of the lateral tibial cartilage during a walking cycle. Areas shown in black are above 7 MPa and will likely degrade. I think one of the most common question we received in our group for ANY publication, was “is your model trustworthy”? Or in words “Nice result, but is it any good?”.
The Golden Standard
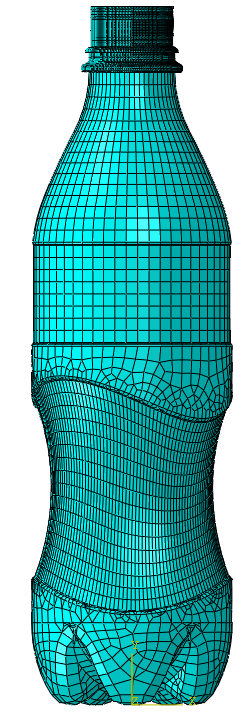
In normal applications the FE model results can be directly validated the FE model results experiments. For instance, in the previous blog, Christine discussed about the importance of material data in a top load analysis. Depending on the material selection, different Force-Displacement curves and limit loads are obtained. The “easiest” way to check which one is the correct version would be to take an actual bottle and do a top load analysis. Unfortunately, that is not really possible for the model above, since it is of a living human knee, and ethical rules prohibit it.
An option here would be to use 3D printing to directly validate the model results. For instance, the geometry for the 3D print is obtained from the MRI and is the same as the FE model. Then the material properties of the FE model are matched to that of the polymer used by the 3D printer. Inserting pressure sensors in this surrogate 3D printed knee would allow then direct validation of FE model results. However, this has to be done for each patient (i.e. each geometry) and there are still some issues with patient-specific motion and patient-specific material properties.
In lieu of this what would be the options?
Literature
One option would be to compare the results against literature values (Figure 2). This is more of a sanity check to ensure that the FE model predicts values within physiologically possible limits, or that at least someone else got a similar result or behavior. Ideally, all the comparison points would be from experimental studies, so that if there are any errors in the FE models they do not propagate. For instance, some of the reaction force and contact area curves in Figure 2 are from instrumented knee implants with sensors attached to the contacting surface. I think this sanity check should be done for whenever possible, even if the nice plots below will never be generated or seen by anyone.
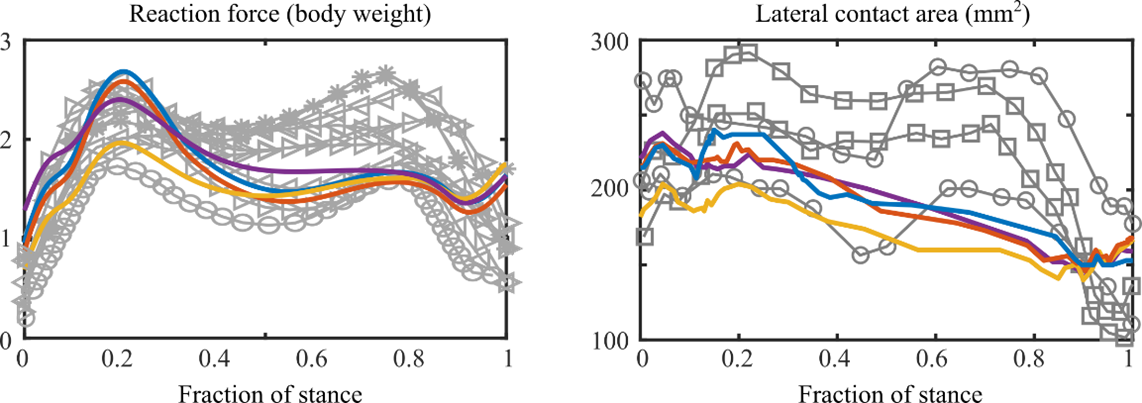
Figure 2. Reaction force (left) and Contact area (right) measured from the FE model and reported in other studies.
Qualitative Verification Methods
Since direct validation is not really possible and the literature comparison just shows that the values from the FE model can happen in the real world, a good alternative is to compare the predicted model behavior against a measured one.
This option essentially asks: do my results visually match real-world behavior? In the knee joint FE model, we predicted collagen network damage (which indicates cartilage degeneration and OA) by evaluating areas with tensile stresses over 7 MPa. The T2 relaxation time of MRI was also shown to be linked to the collagen network integrity. Thus, if the FE model shows high tensile stresses in an area, this area will likely degrade and this should be seen in follow-up MRI images (Figure 3).
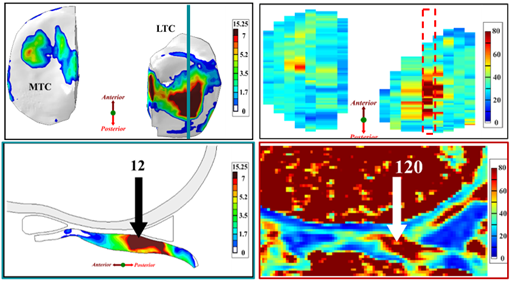
Figure 3. (Left) Tensile stress at 1-year follow-up and (Right) T2 relaxation time at 3-year follow-up. Note: 120ms relaxation time in cartilage is almost triple “normal” values (30-60ms). Note: LTC – lateral tibial cartilage; MTC – medial tibial cartilage.
Alternatively, osteoarthritis can be evaluated using X-Ray and/or MRI. In both cases a radiologist assigns a score based on the degree of degeneration seen in the knee joint (for instance KL grades for X-Ray, MOAKS or WORMS for MRI). It stands to reason that if the FE model predicts a certain area at risk of OA, there should be some signs at a later follow-up time (Figure 4).
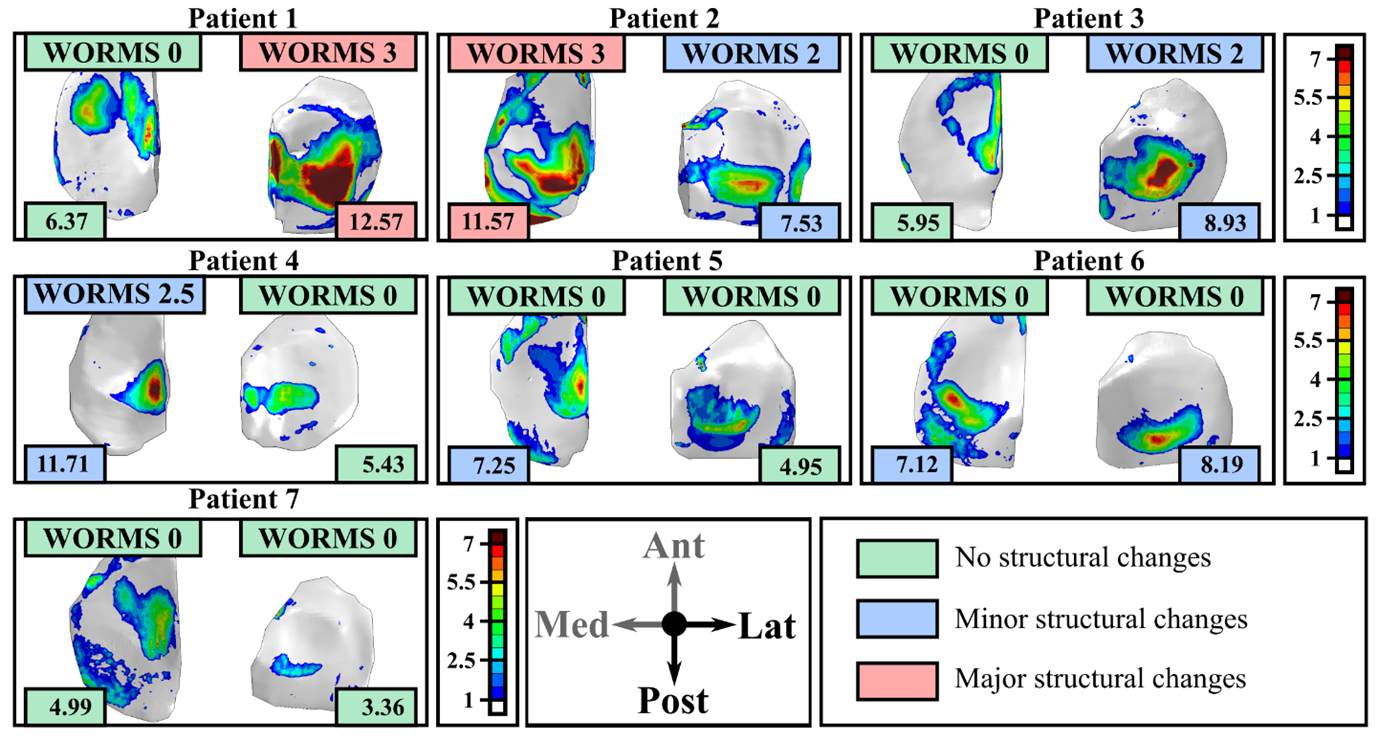 Figure 4: Tensile stresses predicted by the FE models at 1-year follow-up time and WORMS scores at the 3-year follow-up time for seven patients with anterior cruciate ligament reconstruction. Here, two different tensile stress values were used to separate patients in low risk (no structural changes); medium risk (minor structural changes) and high-risk (major structural changes). Similar subdivisions are also done for the WORMS grades.
In this case the FE models were able to predict 5/7 subjects accurately (71%). It’s still worth noting that by making a small adjustment for the tensile threshold from 7 MPa to ~7.3 MPa the accuracy is higher. However in this case, it is better is to have more patients. As the adage says the more the merrier. A colleague obtained 80% match between FE models and 10-year follow-up in 256 knees using even more simplified models (link here).
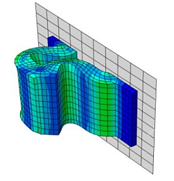
This approach is applied also in more traditional applications. For instance take the collapse behavior of a tube below. If the imperfection are not included the results doesn’t match the behavior in the real world (so the model is not good enough). 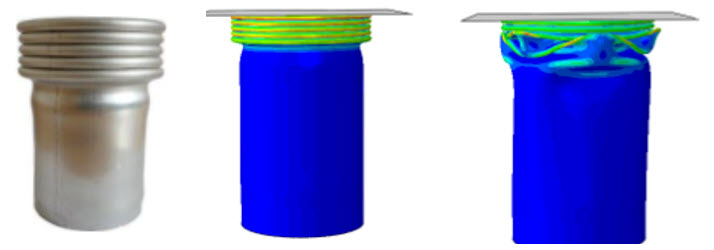
Figure 5: Example of a tube crush. From left to right: real case, model with imperfections added; idealized tube (no imperfections).
Even for the top-load analysis and the material section from Christine’s previous blog, comparing the actual bottle post-buckling behavior may indicate which material model is more appropriate.
Quantitative Verification Methods
For the knee joint FE model we assumed the both the tensile stresses and the T2 relaxation times indicate collagen network damage. It stands to reason that there is some kind of relationship between the two (Figure 6). Whether that relationship is linear or exponential or logarithmic is up for debate, but at least it should be proportional (if there are high stresses you should see high T2 times).
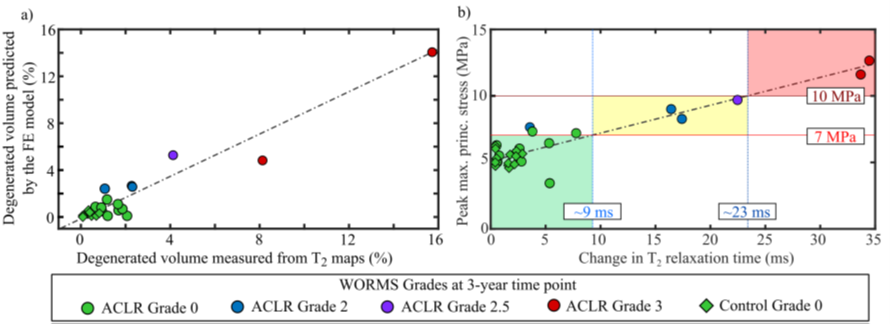
Figure 6: (Left) Degenerated volumes predicted by the FE model and measured from MRI; (Right). Peak tensile stresses and peak changes in T2 relaxation time. Note: points are color-coded according to WORMS grade at 3-years. Image from PhD thesis, more explanation available here.
This kind of analysis should be done with even more data points (i.e. more FE models and more MRI follow-up), but the data is not readily available, plus it still takes ~1 week to generate the FE model for one patient, and with a bit of luck, somewhere between 1–4 weeks to get it to run. But its getting there.
Conclusions
Simplifications and assumptions will always be made in FEA, but there many approaches to evaluate Is my model good enough? or better still Is it reliable? Even though some of these methods do not assess the exact same parameter, such as stress, they are enough to prove that the FE models are indeed reliable. I’d like to think that given enough data (millions?), either the qualitative or quantitative comparison methods will replace the golden standard, at least for the academic world. Do you think this is already the case in industry?


TECHNIA Simulation provides top tier FEA, Non-linear, and Advanced Simulation Software, Training, and Consultancy. Our dedicated team of more than 65 Simulation experts across 16 countries advise and support your innovation with a wealth of specialist knowledge and experience.
About TECHNIA- Related news and articles straight to your inbox
- Hints, tips & how-tos
- Thought leadership articles
Helping you find the information you’re looking for. Discover webinars, events, FAQ's, case studies and tutorials.
VIEW HUB