Background
Concrete is a commonly used material in building structures. In the vast majority of cases, it is used in combination with steel bars (reinforced concrete construction). Simulating the behavior of concrete usually poses a major challenge for engineers and constructors.The main challenge is to take into account the different compression and tensile behavior of concrete (10 times higher compressive strength than tensile strength). The damage and failure mechanism of concrete is also different in the compression and tension zones. Nowadays, Ultra High Performance Concrete (UHPC) with compressive strengths higher than 100 MPa are also available. However, the concrete compression test is the basic test that determines the quality and class of concrete. That is why this test will be presented in this article.
The concrete damage plasticity (CDP) model will be used to describe the behavior of concrete in compression test [1]. The test is initially dominated by compression behavior, but finally the concrete specimen fails, forming characteristic shear zones.
Numerical Modeling
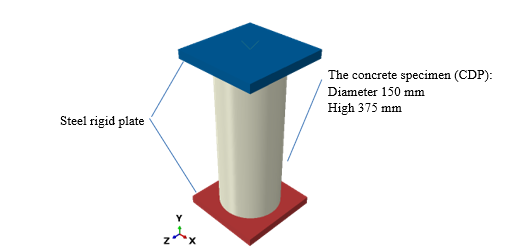
The geometry of the concrete specimen is presented in Fig. 1. The contact with friction coefficient 0.1 is defined between the steel rigid plates and concrete cylinder. The concrete is compressed using the displacement of the upper rigid plate about 1mm while the bottom plate is fixed.
 The CDP model describes the shape of the loading function and plastic flow potential function using four main parameters for different state of stress in both meridian and deviatoric planes. For small strain in compression, the elasto-plastic behavior of concrete is assumed, but it leads to damage and softening behavior for higher strains. During tension, the plastic region is very small and brittle behavior is assumed just after the reaching of the tensile strength in CDP. The energetic regularization of the softening behavior of concrete is used in the CDP model. Therefore, the two uniaxial curves first in compression and second in tension should be defined to complete the possibility of the concrete modelling using CDP. In the numerical model, the lower rigid plate is rotated 1^° to introduce small imperfections. Otherwise, the failure mechanisms found in numerous experiments will not develop correctly.
Numerical Results
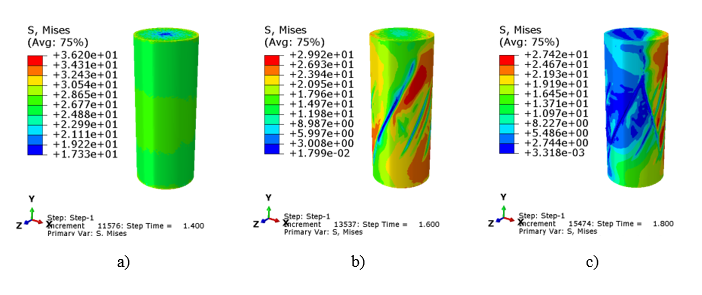
The evolution of the Mises equivalent stress is presented in Fig. 2a-c in three time points. The stress distributions concerns displacement of 0.7, 0.8 and 0.9 mm. At the beginning the stress in whole specimen is close to uniform, but after specimen start to be crushed and softening (lower stress level) is observed.
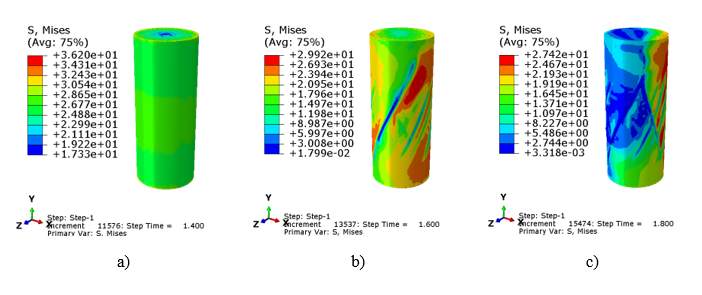
Fig. 2. Stress distribution during concrete compression for displacement:
0.7 mm (a), 0.8 mm (b) and 0.9 mm (c)
The distribution of damage variable in compression is presented in Fig. 3a. The damage shear zones appear after reaching the maximum capacity force (about 500 kN), see Fig. 3b. On the curve, all points from the Fig. 2a-c and Fig. 3a are marked using red dots. It is visible that the concrete during compression fails on descending part of the curve (the concrete softening is visible).
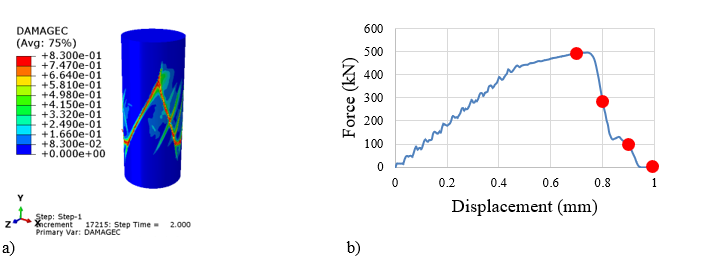
Fig. 3. DamageC distribution during concrete compression for displacement 1 mm (a)
and force versus displacement curve
Conclusions
The CDP model can be used to successfully simulate the behavior of the concrete during compression. The most important observation here is that the Abaqus/Explicit program can be used even if the simulation is rather quasi-static. Thanks to this choice, the numerical problems connected with concrete softening and appearing of the numerical singularities in the solution are avoided. Finally, the expected failure mechanism is visible during the simulation of the concrete compression.
If you would like to get the *.inp file with this model, please write to: tomasz.jankowiak@technia.com.
References
[1] Abaqus. Abaqus/Explicit User’s Manuals, Version 2022.
For more information on all things simulation, visit our TECHNIA Simulation Hub Page below…



 The CDP model describes the shape of the loading function and plastic flow potential function using four main parameters for different state of stress in both meridian and deviatoric planes. For small strain in compression, the elasto-plastic behavior of concrete is assumed, but it leads to damage and softening behavior for higher strains. During tension, the plastic region is very small and brittle behavior is assumed just after the reaching of the tensile strength in CDP. The energetic regularization of the softening behavior of concrete is used in the CDP model. Therefore, the two uniaxial curves first in compression and second in tension should be defined to complete the possibility of the concrete modelling using CDP. In the numerical model, the lower rigid plate is rotated 1^° to introduce small imperfections. Otherwise, the failure mechanisms found in numerous experiments will not develop correctly.


